আরও দেখুন

 11.06.2025 09:28 AM
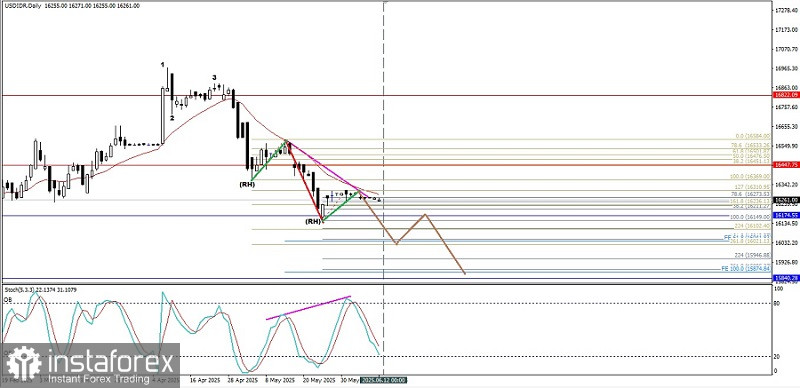
There are some interesting facts about USD/IDR at the moment, first the price movement of USD/IDR is moving below WMA (21), second the appearance of Bearish 123 pattern followed by several Bearish Ross Hook (RH), and third the appearance of Convergence pattern between USD/IDR price movement with Stochastic Oscillator indicator. So, based on these three facts in the near future, USD/IDR has the potential to continue its weakening where the last Bearish Ross Hook level of 16149.00 will be tested to be broken and close below it. If it is successful, then USD/IDR has the potential to continue its weakening back to level 16021.13 as its main target and if momentum and volatility support then 15874.84 will be the next target, but all these weakening scenarios will be invalid and automatically canceled by themselves and become invalid if suddenly USD/IDR strengthens again and closes above level 16584.00.
(Disclaimer)
You have already liked this post today
*এখানে পোস্ট করা মার্কেট বিশ্লেষণ আপনার সচেতনতা বৃদ্ধির জন্য প্রদান করা হয়, ট্রেড করার নির্দেশনা প্রদানের জন্য প্রদান করা হয় না।


