আরও দেখুন

 22.08.2023 11:33 AM
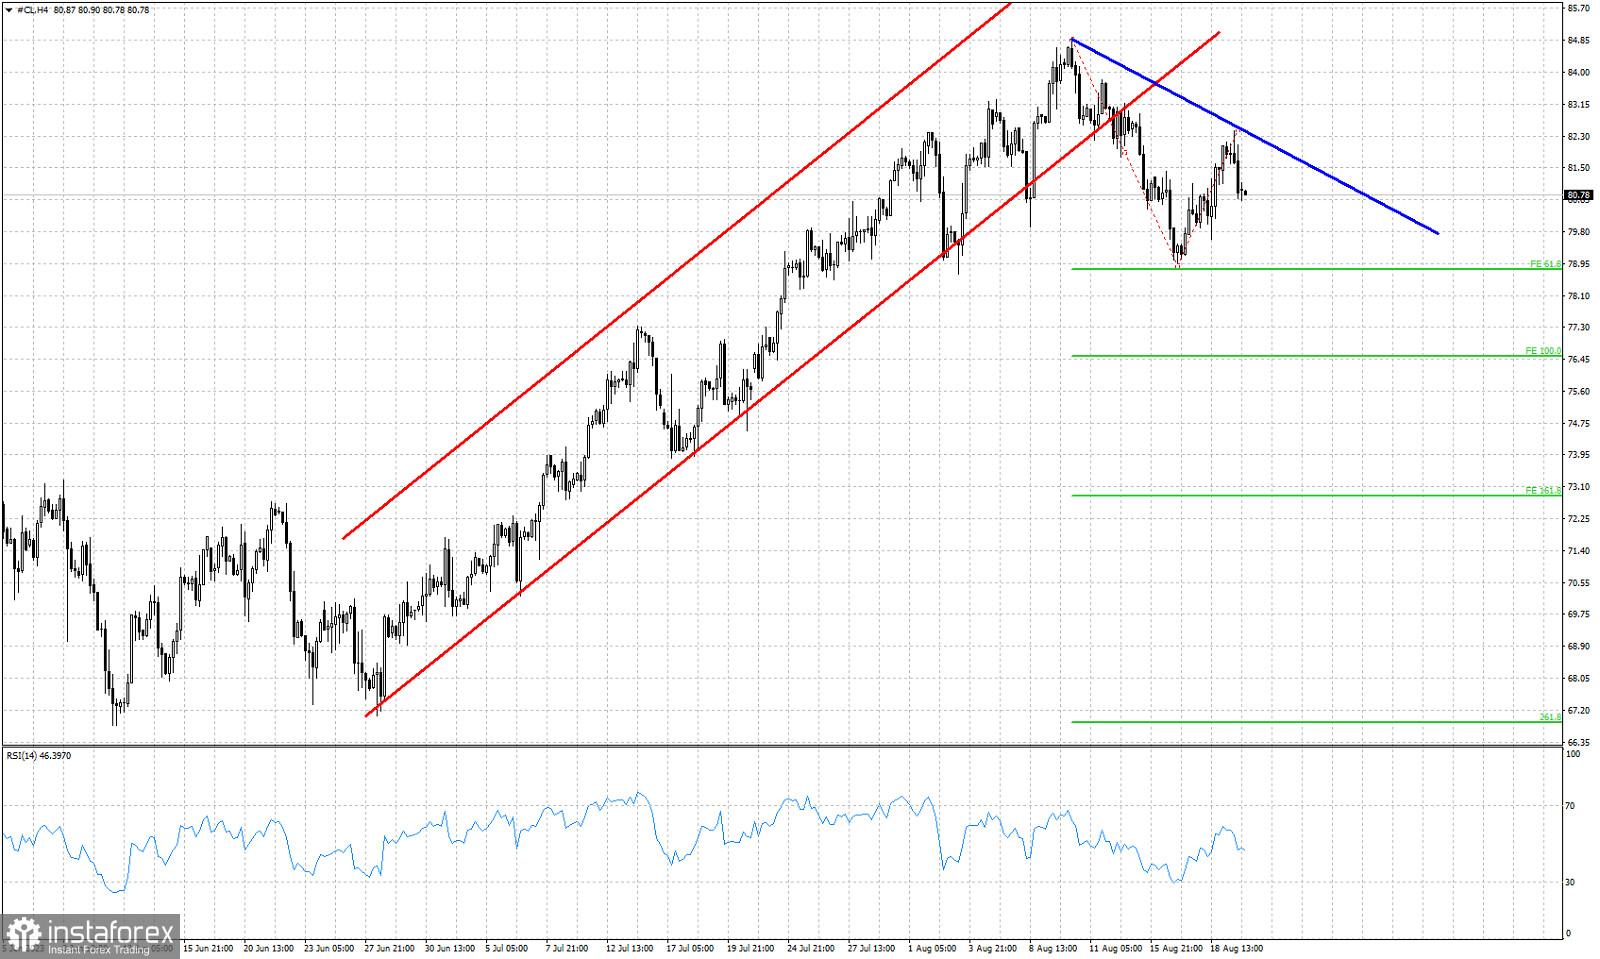
Red lines- bullish channel (broken)
Blue line- resistance trend line
Green lines- Fibonacci extension targets
Oil price is trading around $80.80. Recently price provided a bearish signal by breaking out and below the bullish channel it was in. Price fell towards $79 and then bounced towards $82.60 forming a lower high. As we mentioned in previous posts, our view is that Oil has completed the upward wave from $68 and is now in a correction phase. I believe the correction is not over at $79. This lower high if followed by a break below $79, will open the way for a move even lower towards $76.50 or even $73, These are the two downside targets by the Fibonacci extension tool, taking into consideration that price stays below the recent high of $82.60. The blue trend line is our resistance and we are short-term bearish as long as we trade below it.
You have already liked this post today
*এখানে পোস্ট করা মার্কেট বিশ্লেষণ আপনার সচেতনতা বৃদ্ধির জন্য প্রদান করা হয়, ট্রেড করার নির্দেশনা প্রদানের জন্য প্রদান করা হয় না।


