আরও দেখুন

 08.05.2025 03:39 AM
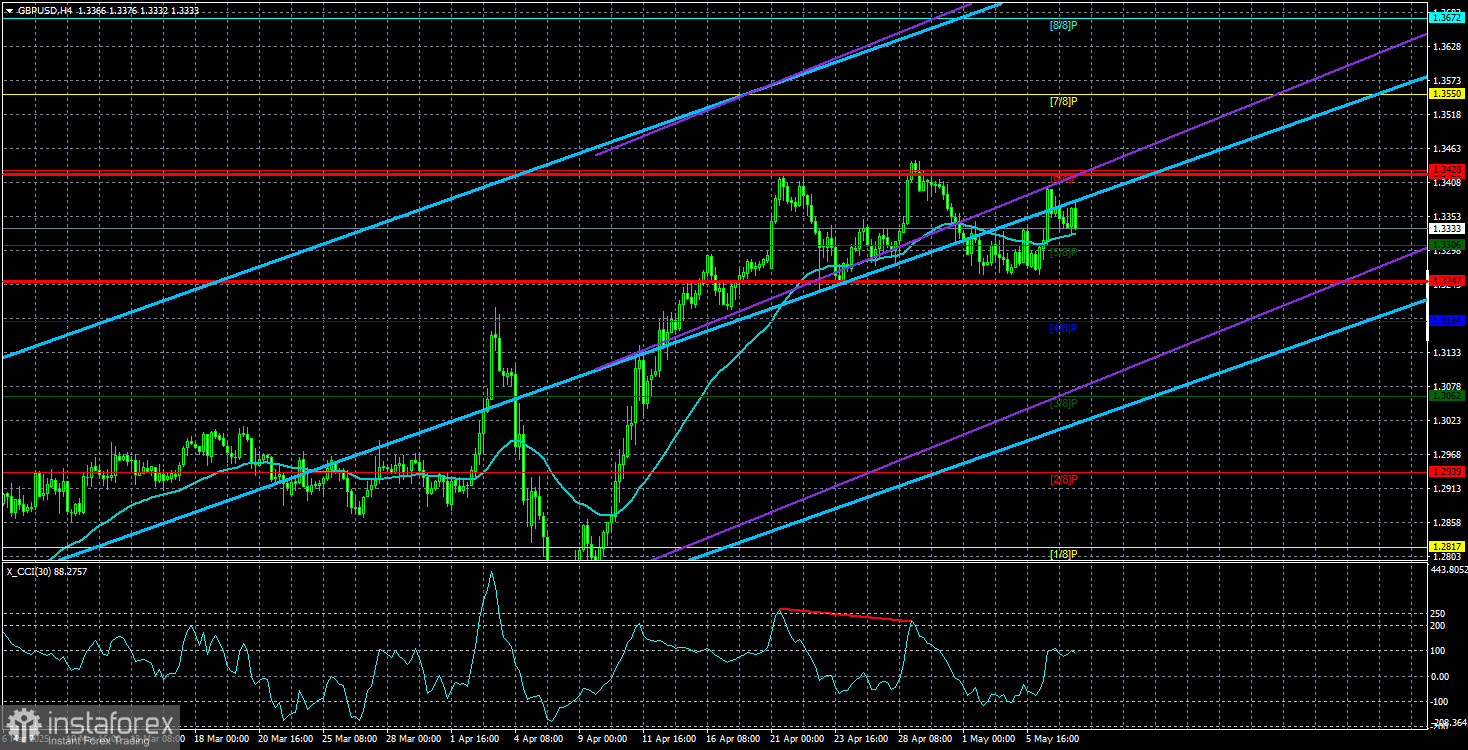
The GBP/USD currency pair traded relatively calmly for most of Wednesday despite the evening FOMC meeting. As per our usual approach, we won't be analyzing the results of that meeting or the market's reaction in this article, as it could be misleading. We believe that at least 24 hours should pass after such an important event before drawing accurate conclusions about how traders respond.
This article, instead, focuses on the broader crisis in the U.S. economy. The U.S. dollar has been falling for a third straight month and shows little ability to correct as the overall fundamental backdrop remains unfavorable. It's important to be precise here: the fundamental backdrop tied to Trump's trade policy is hurting the dollar. For example, the Federal Reserve's current stance—keeping the key rate at 4.5% in 2025—would normally support the dollar. In contrast, the Bank of England is expected to cut rates two to four times this year, a more dovish path.
So, comparing central bank policies alone, the Fed and the dollar should be winning. However, this factor is irrelevant because the "Trump factor" outweighs it. Why? Because just three months of Trump in office led to a sharp decline in U.S. growth, from +2.4% to –0.3%. And it's not just the Q4 2024 data, but also Q3, when the economy grew more than 3%. That means average U.S. GDP growth was around 3%, but in the first quarter under Trump, it contracted by 0.3%. And this is only the beginning: he hasn't signed any major trade agreements yet. With China and the EU—America's top trading partners—no talks are even underway.
The real problem is more than tariffs: the global market's response to these sanctions. In Canada, Europe, and many other countries, ordinary consumers are now deliberately boycotting American products. The apex of this backlash is Tesla's collapse in global sales. Tesla sales have dropped by 60–80% in some European countries. If that's not a protest against all things American, what is?
Elon Musk, once a supporter of Trump and later pushed away from the White House, made a major mistake by diving into politics. But the issue isn't just Elon. The core problem is how the world perceives U.S. trade policy as hostile and aggressive. If Trump wants Europe or China to pay more to America just for the privilege of trading, consumers are now willing to stop buying American.
And Trump himself now doesn't seem to know how to even begin trade talks with the EU or China. Brussels and Beijing aren't running to Washington, begging for a deal. As we've said, weaker players seek compromise, while strong ones resist. What matters most to the U.S. is the fate of the strong.
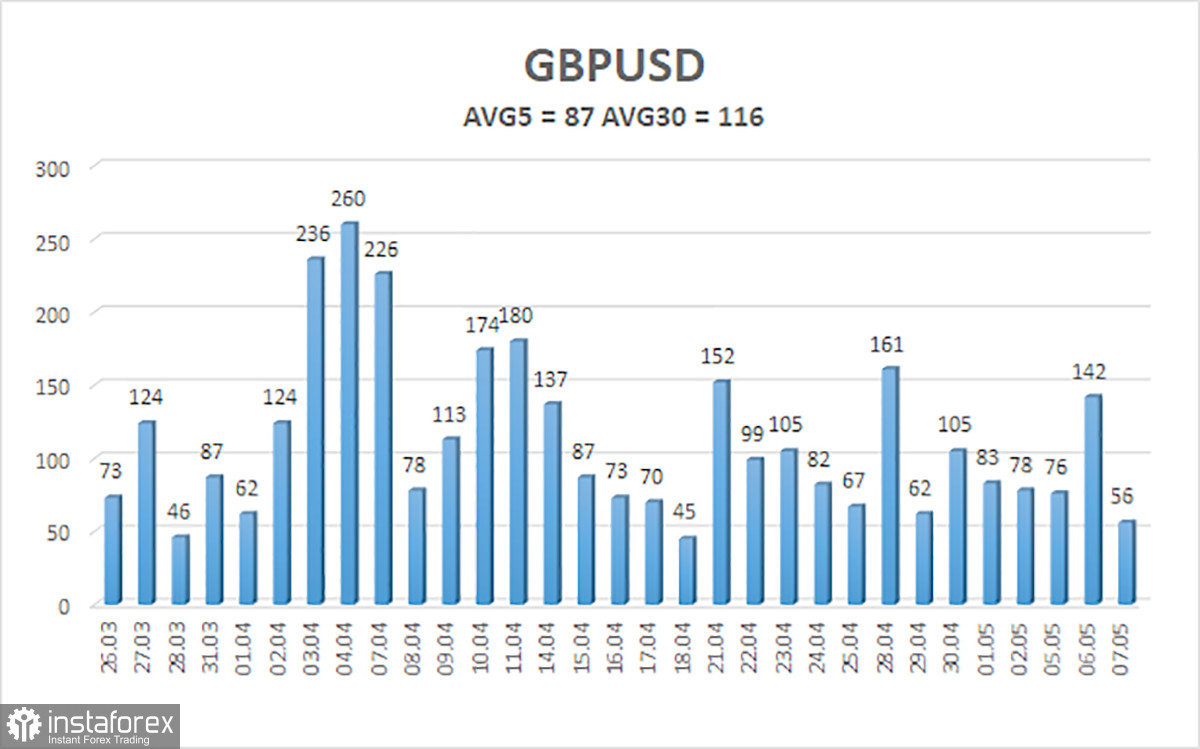
The average volatility for the GBP/USD pair over the past five trading days is 87 pips, which is considered "average" for the pound/dollar pair. On Thursday, May 8, we expect the pair to move within the range defined by the levels 1.3247 and 1.3421. The long-term regression channel is upward-sloping, which confirms a clear bullish trend. The CCI indicator previously showed a bearish divergence, which led to the recent drop, now completed.
S1 – 1.3306
S2 – 1.3184
S3 – 1.3062
R1 – 1.3428
R2 – 1.3550
R3 – 1.3672
The GBP/USD pair remains in an uptrend, having quickly completed another shallow correction. We believe there are no fundamental reasons for the pound to rise. The pound's rally is driven entirely by the decline in the U.S. dollar, which has been falling for two months, solely due to Donald Trump.
As such, Trump's actions could just as easily trigger a sharp decline in GBP/USD or a new upward move. If you trade based on technicals or Trump-related news, long positions are valid with targets at 1.3421 and 1.3428 as long as the price remains above the moving average. Short positions also remain attractive, targeting 1.3247 and 1.3184 if the price moves below the moving average.
Linear Regression Channels help determine the current trend. If both channels are aligned, it indicates a strong trend.
Moving Average Line (settings: 20,0, smoothed) defines the short-term trend and guides the trading direction.
Murray Levels act as target levels for movements and corrections.
Volatility Levels (red lines) represent the likely price range for the pair over the next 24 hours based on current volatility readings.
CCI Indicator: If it enters the oversold region (below -250) or overbought region (above +250), it signals an impending trend reversal in the opposite direction.


