আরও দেখুন

 13.05.2025 07:30 AM
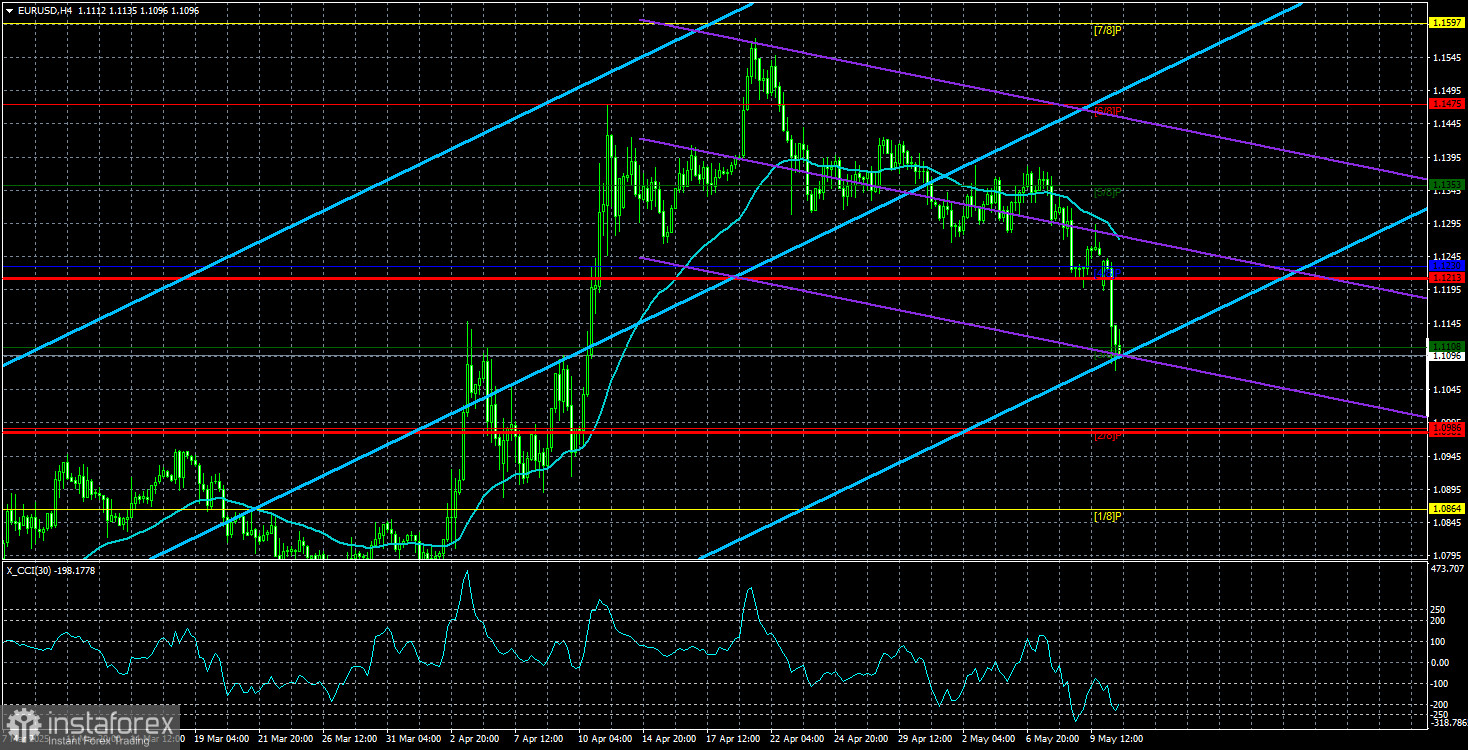
On Monday, the EUR/USD currency pair dropped sharply, like a rock falling. Can you guess who deserves the credit for that? It's none other than Donald Trump. Though this time only indirectly. Over the weekend, initial consultations between China and the United States were scheduled regarding a trade agreement and tariff reductions. Few expected any real breakthrough, yet on Monday, U.S. Treasury Secretary Scott Bessent announced that Washington and Beijing had agreed to reduce tariffs on each other's goods by 115%.
To recap, the two sides had previously reached extreme tariff levels of 145%-125% in favor of the U.S. Now, new tariffs of 30% on Chinese imports into the U.S. and 10% on American imports into China will be implemented. Naturally, it's too early to talk about a full-fledged truce, as these reduced tariffs will only be in effect for 90 days.
What's likely to happen over the next three months seems quite predictable: China and the U.S. will probably spend that time negotiating a comprehensive trade framework in hopes of not having to revisit this issue—at least for a few years or until Donald Trump again declares that the world is unfair to the U.S.
In the meantime, the dollar immediately began rising sharply. In recent months, we've repeatedly stated that Trump is steering the markets. Over the past two months, the U.S. dollar has lost more than 1,000 pips against the euro, the pound, and other currencies. However, we warned that the dollar would start gaining strength if the trade war de-escalated. Although it's too soon to say the trade war is over, there are at least some signs pointing toward its resolution. So while a return of the EUR/USD pair to the 1.03–1.04 range isn't yet on the table, the U.S. dollar could still gain another few hundred points.
We'd also like to remind readers that Trump's trade war was the only reason for the dollar's decline. If the U.S. president ends up signing agreements with all the sanctioned countries under terms more favorable to America, the dollar should not only recover to the 1.03–1.04 range but even strengthen beyond parity with the euro. The U.S. economy would begin recovering rapidly after a weak Q1, and there shouldn't be any issues with the labor market or unemployment.
At that point, the market would also remember that the European Central Bank had been cutting rates throughout this period, while the Federal Reserve kept its key rate at 4.5%. This extremely bullish factor for the dollar has not yet been priced in. Therefore, we'd argue that if de-escalation continues, the dollar may head for parity with the euro—a goal we discussed as far back as last year.

The average volatility of the EUR/USD currency pair over the last five trading days as of May 13 is 116 pips, which is characterized as "high." We expect the pair to move between 1.0981 and 1.1213 on Tuesday. The long-term regression channel remains upward, still indicating a short-term uptrend. The CCI indicator entered the oversold zone last week, which typically suggests a trend resumption in an uptrend, but the trade war has once again disrupted that pattern.
S1 – 1.1108
S2 – 1.0986
S3 – 1.0864
R1 – 1.1230
R2 – 1.1353
R3 – 1.1475
The EUR/USD pair continues a downward correction within a longer-term uptrend. Over the past few months, we've consistently forecast a medium-term decline in the euro, and that view has not changed. The dollar still has no reason to fall, except for Donald Trump. Recently, Trump appeared to have committed to a trade truce. Therefore, the trade war factor now supports the U.S. currency, which may quickly return to levels around 1.03. Under current conditions, we do not consider long positions relevant. Shorts remain appropriate if the price stays below the moving average, with targets at 1.0986 and 1.0864.
Linear Regression Channels help determine the current trend. If both channels are aligned, it indicates a strong trend.
Moving Average Line (settings: 20,0, smoothed) defines the short-term trend and guides the trading direction.
Murray Levels act as target levels for movements and corrections.
Volatility Levels (red lines) represent the likely price range for the pair over the next 24 hours based on current volatility readings.
CCI Indicator: If it enters the oversold region (below -250) or overbought region (above +250), it signals an impending trend reversal in the opposite direction.


