আরও দেখুন

 09.06.2025 02:09 PM
In my morning forecast, I focused on the 1.1430 level and planned to base entry decisions around it. Let's look at the 5-minute chart and see what happened. The pair rose and formed a false breakout at this level, leading to an entry point for selling the euro. However, after a 10-point correction downward, a more significant movement didn't occur. The technical picture remained unchanged for the second half of the day.

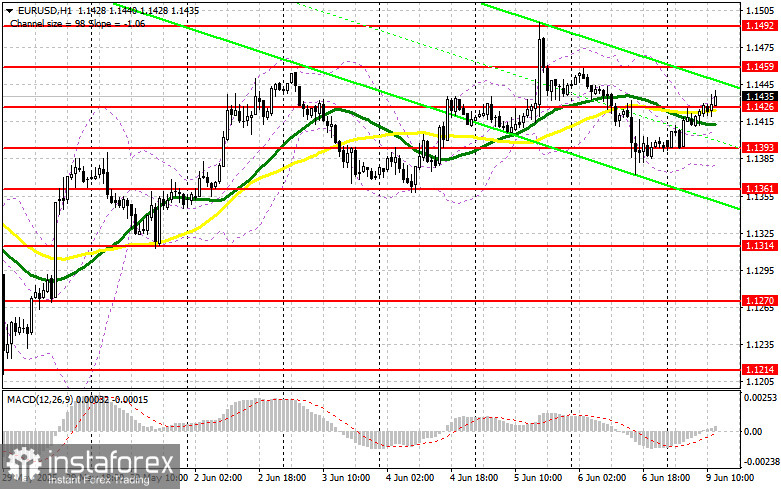
The lack of Eurozone statistics allowed euro buyers to recover their positions after Friday's sell-off, but stronger movements have yet to materialize. Given that no major U.S. macroeconomic statistics are scheduled for the second half of the day, all attention will shift to the outcome of the U.S.-China trade talks currently underway in London. If the pair declines and the market reacts negatively, focus will shift to defending the 1.1393 support. A false breakout there, similar to the morning pattern, would be a signal to buy EUR/USD, aiming for a retest of the 1.1426 resistance, where trading is currently occurring. A breakout and retest from above will confirm the correct entry point, with a target at the 1.1459 level. The furthest target will be 1.1492, where I will lock in profits. If EUR/USD falls and there is no activity around 1.1393, selling pressure could quickly increase, leading to a larger decline. Bears could then push the pair down to 1.1361. Only after a false breakout at this level will I consider buying the euro. I plan to buy immediately on a rebound from the 1.1314 support level, targeting a 30–35 point intraday correction.
Sellers tried in the first half of the day but couldn't achieve much. It's better to wait for the results of the negotiations and then act. A false breakout around the 1.1459 resistance would be a signal for short positions, aiming for a decline toward the 1.1426 support, where the moving averages are currently favoring bulls. A breakout and consolidation below this range would be an appropriate sell signal, aiming for 1.1393. The furthest target will be 1.1361, where I plan to take profit. If EUR/USD rises in the second half of the day and sellers are inactive around 1.1459, buyers could push the pair further, updating the monthly high at 1.1492. I will only sell there after a failed breakout. Otherwise, I will consider short positions on a rebound from 1.1530, targeting a 30–35 point intraday correction.
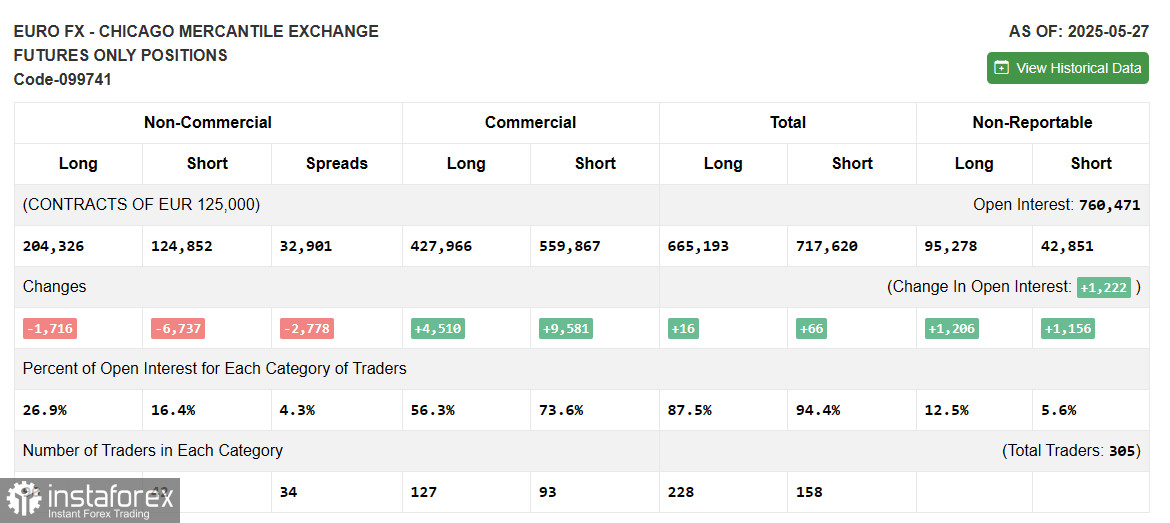
The COT (Commitment of Traders) report from May 27 showed a reduction in both long and short positions. However, it is clear that the advantage remains with the buyers. Traders are preparing for another ECB meeting, where another rate cut is expected. Many economists believe this could be the last cut before a significant pause, which may help strengthen the euro in the short term. Add to that the GDP report and U.S. labor market data, and the week promises to be quite eventful. The COT report indicated that long non-commercial positions fell by 1,716 to 204,326, while short non-commercial positions fell by 6,737 to 124,852. As a result, the gap between long and short positions narrowed by 2,778.
Indicator Signals:
Moving Averages Trading is occurring around the 30- and 50-day moving averages, indicating market uncertainty.Note: The period and prices of the moving averages are considered by the author on the hourly H1 chart and differ from the standard definition of classical daily moving averages on the D1 chart.
Bollinger Bands In case of a decline, the lower boundary of the indicator around 1.1380 will act as support.
Indicator Descriptions:


