আরও দেখুন

 20.06.2025 07:16 AM
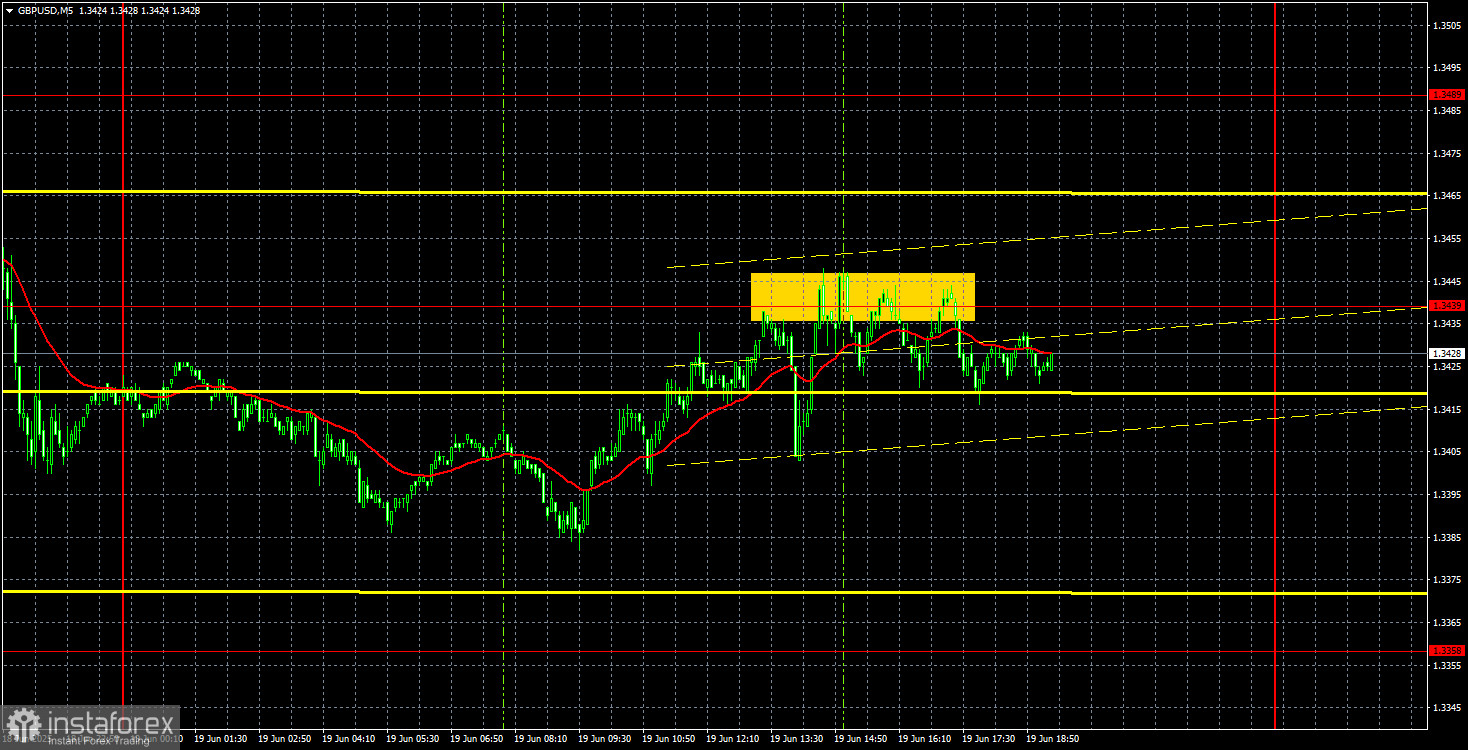
The GBP/USD currency pair continued its downward movement on Thursday, but only briefly. In the second half of the day, when the results of the Bank of England meeting were announced, the British pound began to rise. Daily volatility was very weak, so the pound failed to appreciate significantly. However, the pound hasn't faced any major problems with growth over the past five months. If it didn't rise today, it may rise tomorrow. The Bank of England decided not to change the key rate, but the vote split 3–6 rather than the expected 2–7. Thus, the outcome of the meeting can be considered more dovish than anticipated.
Nevertheless, the pound did not come under pressure because of it. There was no macroeconomic background on the day, but a day earlier, the UK inflation report indicated that the indicator remained at a fairly high level. We believe that the current level of consumer prices does not allow for further monetary policy easing, but the BoE itself signaled it is ready to continue slowly lowering the key rate.
A downward trend has formed from a technical standpoint, but it is still very hard to believe in the continued strengthening of the dollar since the fundamental background has not changed recently. The dollar corrected over the past week, but what can it rely on for further growth?
On Thursday, the price bounced four times from the 1.3439 level in the 5-minute time frame, and not once did it show a significant decline. Therefore, traders could have opened short positions, but realizing any profit or loss from them was extremely difficult.
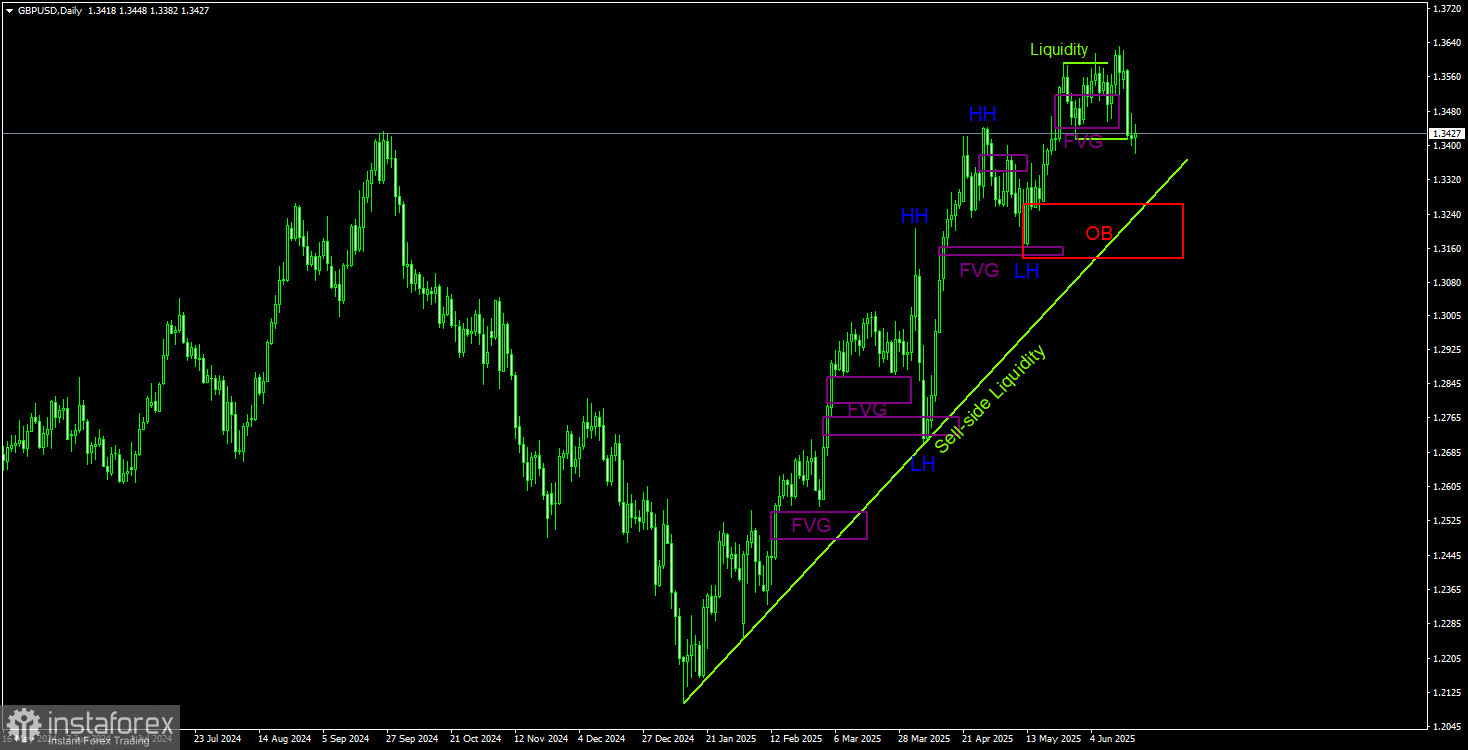
On the daily chart using the ICT methodology, a strong uptrend remains. Tuesday's decline should not concern traders—it may simply have been a liquidity grab for further buying. The pair has two local lows from which liquidity could be taken before a continued rise. Liquidity has already been swept from the first low. The most recent bullish Fair Value Gap (FVG) was tested twice and responded both times, making it less relevant now. A bullish Order Block remains below, and a drop to that level could precede a trend continuation. However, at this stage, any dollar strength is viewed with skepticism.
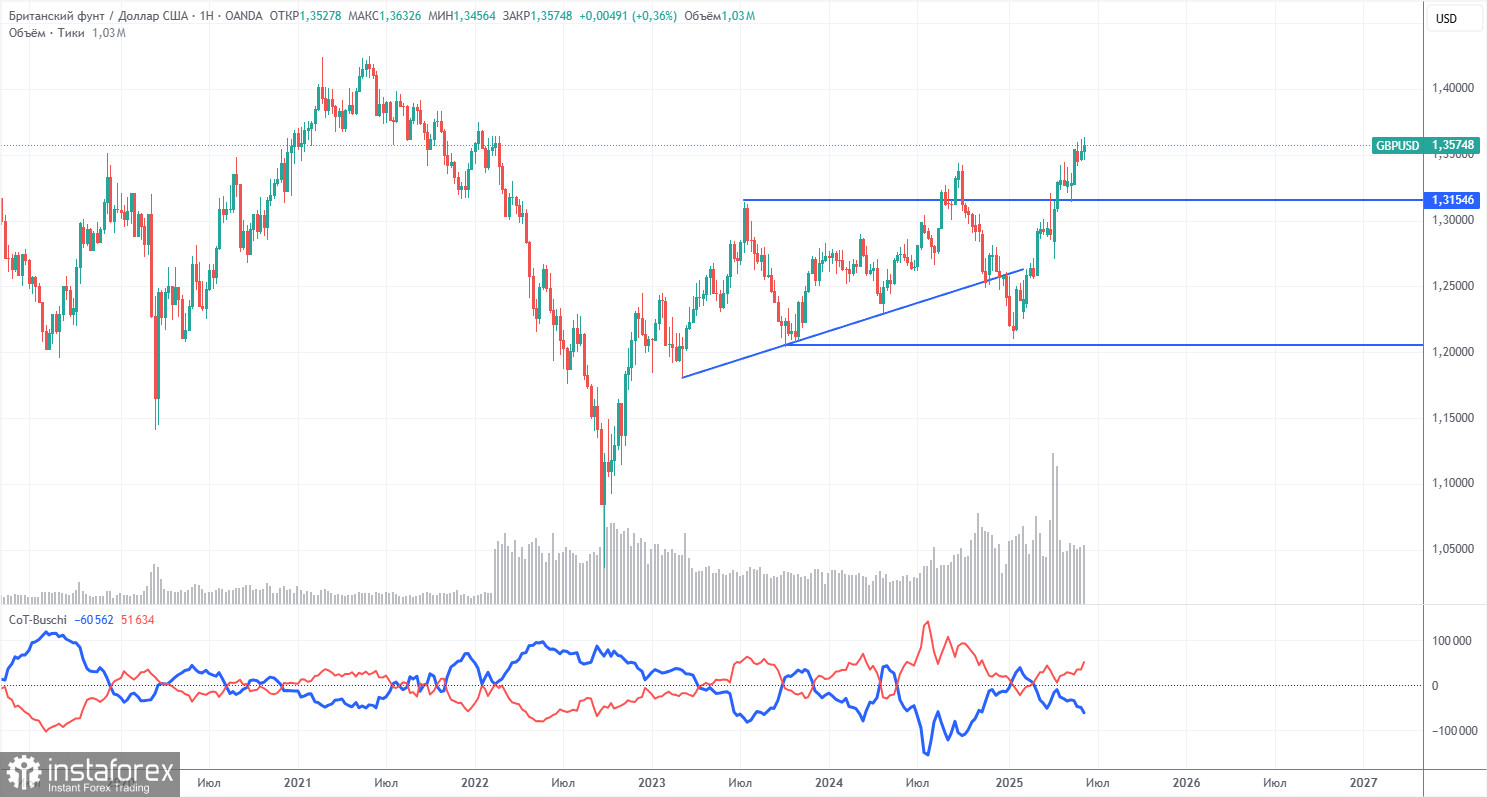
COT (Commitment of Traders) reports on the British pound show that commercial trader sentiment has fluctuated continuously in recent years. The red and blue lines representing net positions of commercial and non-commercial traders frequently cross and mostly hover near the zero mark. They are still close to each other, indicating an approximate balance of buy and sell positions. However, the net position has grown over the past year and a half.
The dollar continues to decline due to Trump's policies, so market makers' demand for the pound isn't particularly crucial at the moment. If the de-escalation of the global trade war resumes, the U.S. dollar could have a chance to rebound. According to the latest report on the British pound, the "Non-commercial" group opened 7,400 BUY contracts and closed 9,000 SELL contracts. As a result, the net position of non-commercial traders increased by 16,400 thousand contracts over the reporting week—a significant gain.
Recently, the pound has strengthened sharply, but the reason is singular—Trump's policies. Once this factor is neutralized, the dollar may start to recover. But when will that happen? No one knows. Trump is still in the early phase of his presidency. What other shocks await in the next four years?
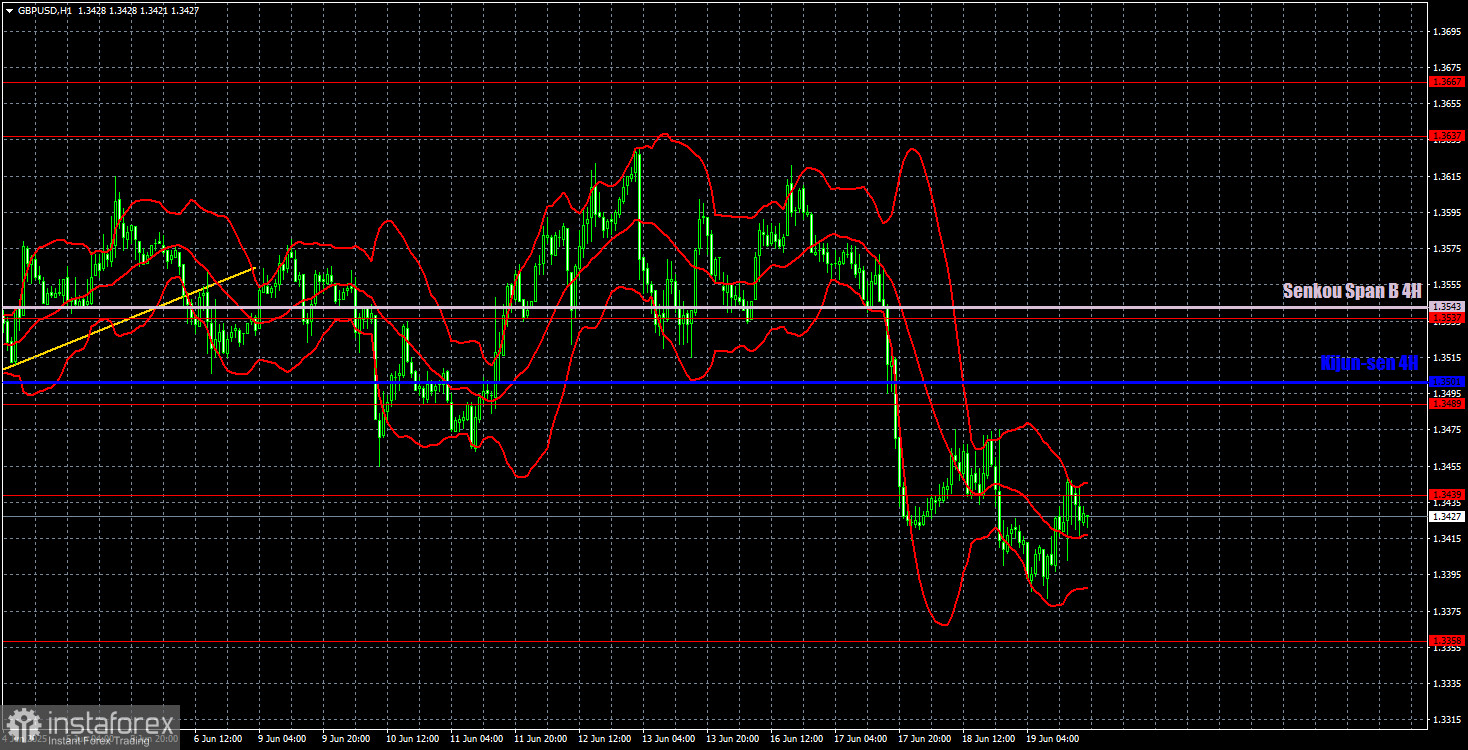
In the hourly time frame, the GBP/USD pair has formed a very weak downward trend, which could end at any moment. The U.S. dollar occasionally corrects, but the market remains focused on buying in the medium term. Ahead of the Federal Reserve meeting, the dollar slightly improved its position, but the markets cannot keep reacting to every escalation in the Middle East conflict. In the daily time frame, there is a chance of a reversal to the upside as early as today.
For June 20, we highlight the following important levels: 1.3050, 1.3125, 1.3212, 1.3288, 1.3358, 1.3439, 1.3489, 1.3537, 1.3637–1.3667, and 1.3741. The Senkou Span B (1.3543) and Kijun-sen (1.3501) lines may also serve as sources of signals. A Stop Loss level is recommended to be set to breakeven after the price moves 20 pips in the right direction. The Ichimoku indicator lines may shift during the day, which should be considered when determining trading signals.
The UK will publish its retail sales report on Friday, while the U.S. calendar is empty. Therefore, even the retail sales report may trigger some market reaction. And, of course, one must be prepared for the possibility that the U.S. will launch a missile strike on Iran, which could provoke heightened market volatility.


