আরও দেখুন

 23.06.2025 03:50 AM
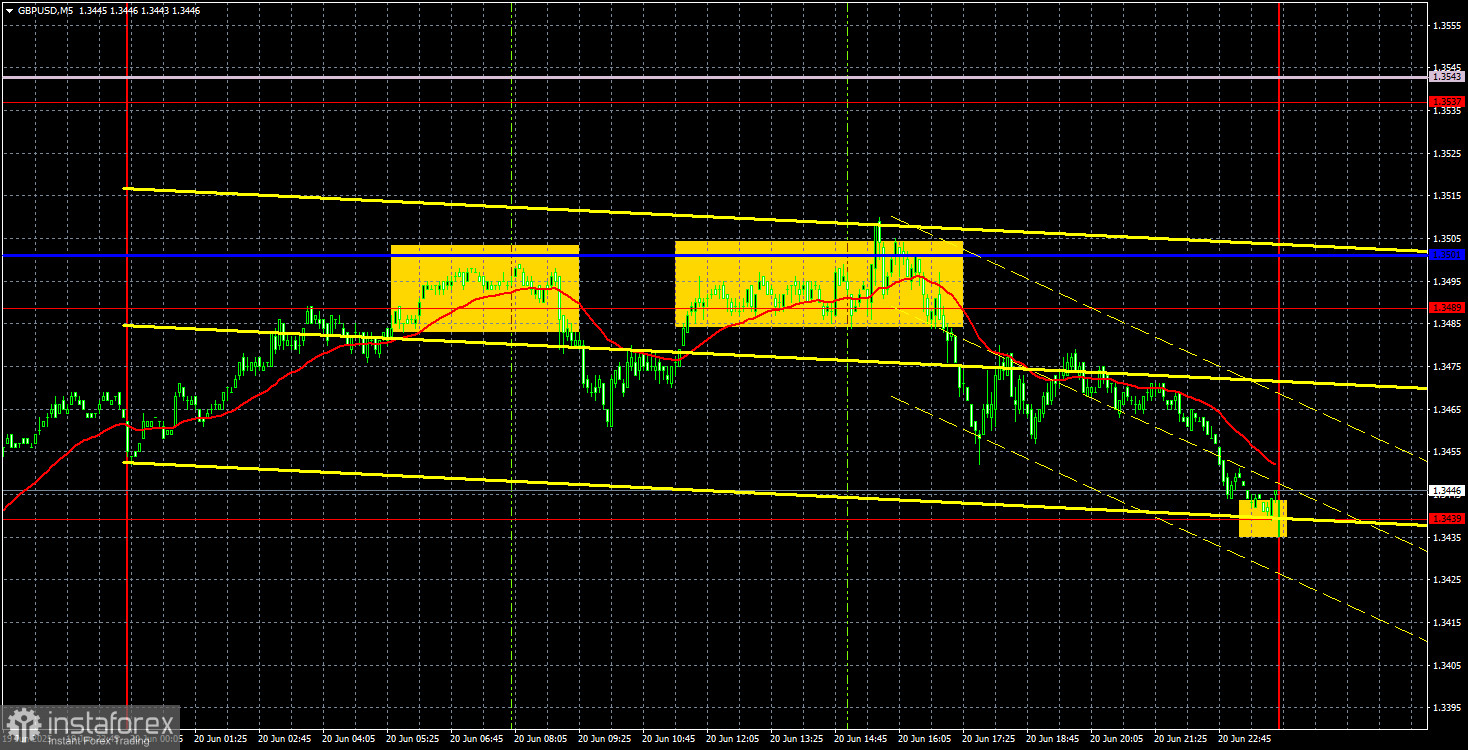
On Friday, the GBP/USD currency pair initially rose before falling, but the key takeaway is found elsewhere. While the euro maintains an uptrend on the hourly timeframe and shows strong buy signals on the daily chart, the pound presents the opposite picture. The GBP/USD pair remains in a downtrend on the hourly chart, with the price below both Ichimoku indicator lines. On the daily chart, there's a bearish FVG (Fair Value Gap) pattern that has already triggered a market response. Thus, a pound decline appears likely on Monday, while the euro may rise.
This presents two possible scenarios: Either the two currency pairs will exhibit opposite trends Or the technical setup of one of them will be entirely broken.
Since Monday's market will be driven not by macroeconomic or fundamental data but by news related to Iran and the U.S., it's hard to predict which pair's technical structure will be disrupted. As previously stated, rising geopolitical tensions in the Middle East typically support the dollar. However, the U.S. entering into war with Iran is a negative factor for the greenback. We are in for some surprises today.
On Friday, the 5-minute TF showed two complex sell signals—complex in that both took hours to form. The price rebounded twice from the 1.3489–1.3501 zone. In the first case, it dropped only 20 pips, enough to move the Stop Loss to breakeven. The decline was more significant in the second, with the price reaching the 1.3439 target right before the market closed.
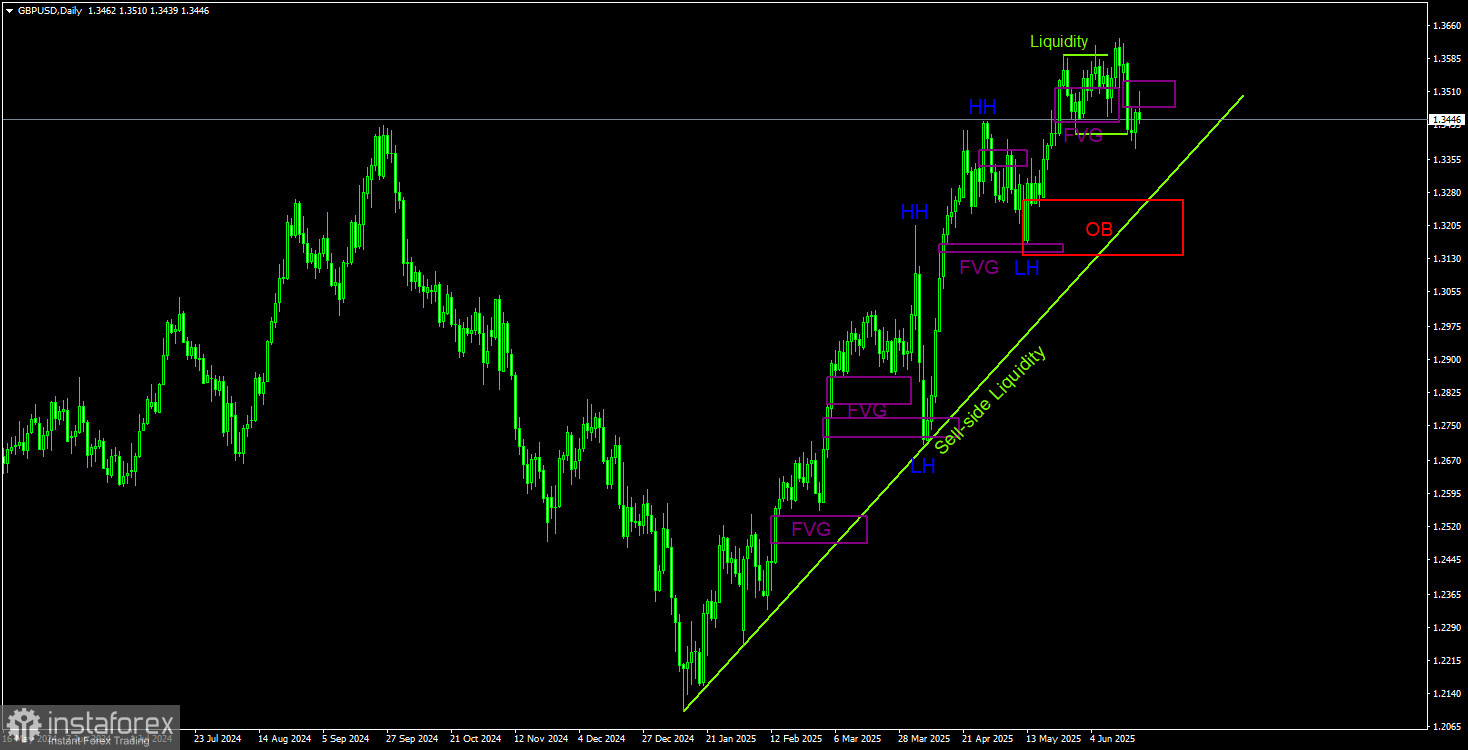
We observe a strong upward trend in the daily timeframe using ICT methodology. The decline on Tuesday should not mislead traders—it might have been a standard liquidity grab. Therefore, the British currency could resume its growth this week.
However, last week saw the formation of a new bearish FVG, which already elicited a reaction on Friday. This means that a decent sell signal has appeared within an ongoing bullish trend, and the pound has downside potential. There is also a clear target—the Order Block. Yet, above all, news flow will dominate, potentially overriding both the signal and the current technical setup.

COT reports for the British pound show that commercial traders' sentiment has fluctuated frequently in recent years. The red and blue lines, representing net positions of commercial and non-commercial traders, often intersect and usually hover near zero. They also remain close now, indicating an approximately equal number of long and short positions. However, over the past 18 months, the net position has been trending upward.
The dollar continues to weaken due to Donald Trump's policies, so the current interest of market makers in the pound isn't particularly relevant. If the global trade war begins to de-escalate, the U.S. dollar may have a chance to strengthen. According to the latest report on the British pound, the "Non-commercial" group opened 7,400 new long contracts and closed 9,000, resulting in a weekly net increase of 16,400 contracts—a notable shift.
The pound has risen sharply lately, but it's important to remember that the primary reason is Trump's policy agenda. Once that factor is neutralized, the dollar could start to gain again—but no one knows when that will happen. The dollar is still in the early stages of Trump's presidency. What further shocks await over the next four years?
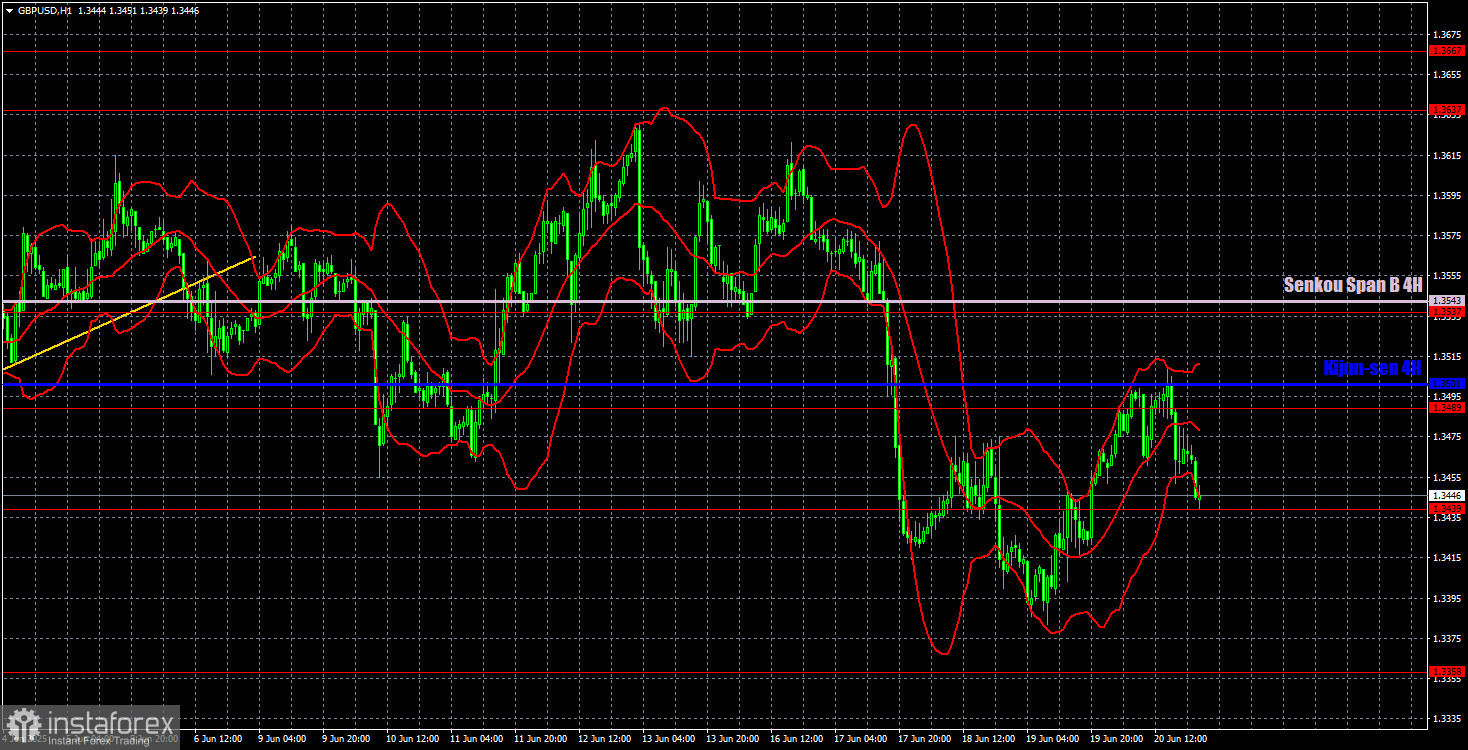
In the hourly timeframe, GBP/USD has formed a downtrend that may end anytime. The dollar occasionally corrects upward, but the market remains oriented toward buying over the medium term. The hourly technical picture favors the dollar. So does the short-term daily picture. But today's news backdrop could trigger any kind of market response.
For June 23, we highlight the following important levels: 1.3050, 1.3125, 1.3212, 1.3288, 1.3358, 1.3439, 1.3489, 1.3537, 1.3637–1.3667, and 1.3741. Senkou Span B (1.3543) and Kijun-sen (1.3501) lines can also be sources of signals. If the price moves 20 pips in the right direction, the stop loss should be moved to breakeven. Remember that the Ichimoku indicator lines can shift throughout the day, which should be factored in when identifying signals.
In the U.S. and the U.K., business activity indices for the services and manufacturing sectors will be released. However, we believe traders may overlook these reports. Instead, Monday could bring a new "storm," the duration of which will now depend not only on the Iran–Israel conflict but also on U.S. involvement.


