আরও দেখুন

 23.06.2025 06:07 PM
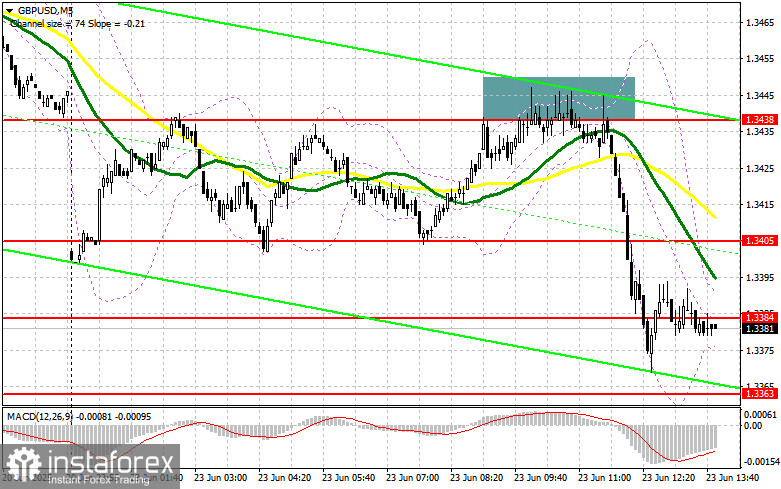
In my morning forecast, I focused on the 1.3438 level and planned to make trading decisions based on it. Let's look at the 5-minute chart and analyze what happened. A rise and formation of a false breakout at that level provided an entry point for selling the pound, resulting in a drop of more than 50 points. The technical picture was revised for the second half of the day.
To Open Long Positions on GBP/USD:
Rather decent UK PMI data gave only temporary support to the pound, after which pressure on the pair returned. The cause is geopolitical tensions and Iran's response to recent U.S. strikes. Although we expect U.S. business activity indices and existing home sales data later today, market focus will remain on the escalation of military conflict in the Middle East. Speeches by FOMC members Michelle Bowman and John Williams will also draw some attention.
However, the pound is unlikely to show any strong or directional movement, so it's better to concentrate on further selling. If GBP/USD declines, I prefer to act near the new support at 1.3363. A false breakout at that level will provide a good entry point for long positions with the target of returning to resistance at 1.3405. A breakout and retest from above will serve as confirmation for new long entries, with a prospect of retesting 1.3441. The ultimate target will be the 1.3474 level, where I plan to take profits.
If GBP/USD continues to fall and there is no buyer activity near 1.3363 in the second half of the day, pressure on the pound may intensify. In that case, only a false breakout around 1.3335 will justify entering long positions. I plan to buy GBP/USD on a rebound only from the 1.3311 support level, targeting a 30–35 point intraday correction.
To Open Short Positions on GBP/USD:
Sellers maintain control of the market. If GBP/USD attempts to rise after weak U.S. data, a false breakout around 1.3405 will be a signal to enter short positions, aiming for a decline to the 1.3363 support — the new weekly low. A breakout and retest from below will trigger stop-losses, paving the way to 1.3335. The ultimate target will be the 1.3311 level, where I plan to take profits.
If demand for the pound returns in the second half of the day and bears fail to act around 1.3405, a larger spike in GBP/USD is possible. In this case, it's better to delay selling until a test of resistance at 1.3441, where moving averages, currently favoring the bears, are located. I will only open short positions there if a false breakout occurs. If there's no downward move there either, I will look for short entries on a rebound around 1.3474, targeting a 30–35 point correction.
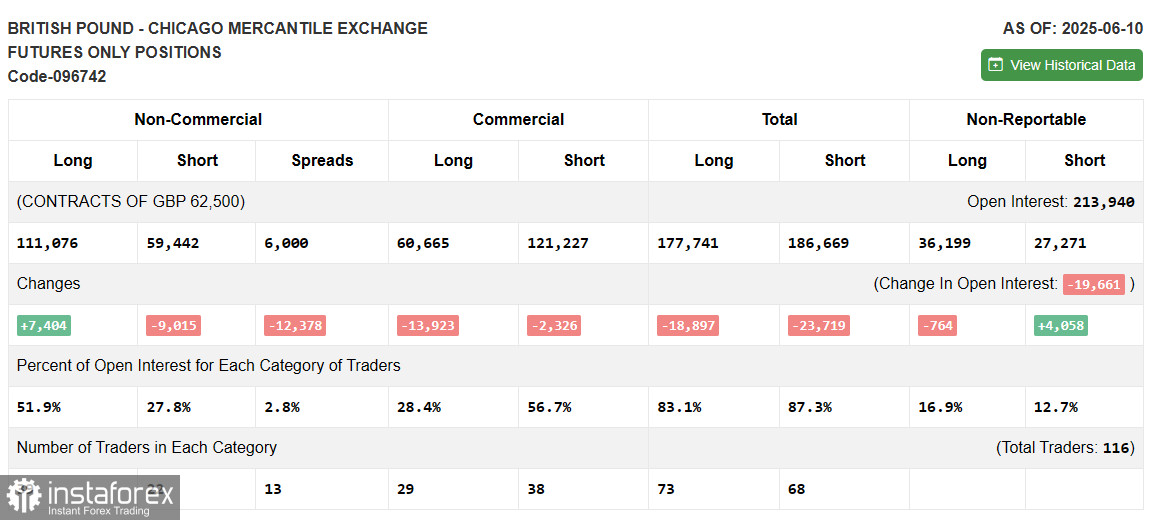
COT Report (Commitment of Traders) as of June 10:
The report showed an increase in long positions and a decrease in short ones. Despite clear signs that the Federal Reserve is keeping interest rates unchanged, the release of data indicating a significant slowdown in U.S. inflation did not provide strong support for the U.S. dollar, boosting demand for the British pound.
A key factor for the dollar's future performance will be Jerome Powell's interpretation of the inflation situation and his projections regarding potential rate cuts in the fall of this year. The direction of the GBP/USD pair, which is currently showing steady growth, will largely depend on these comments.
According to the latest COT report, long non-commercial positions increased by 7,404 to 111,076, while short non-commercial positions fell by 9,015 to 59,442. As a result, the gap between long and short positions narrowed by 12,378.
Indicator Signals:
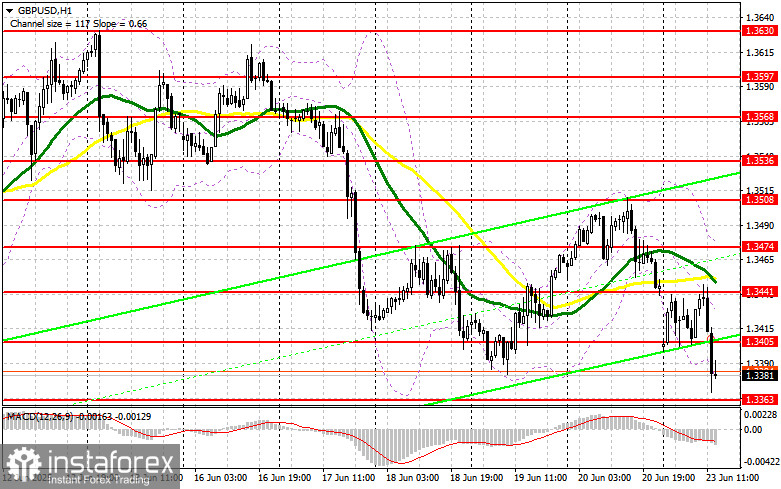
Moving AveragesTrading is taking place below the 30- and 50-day moving averages, indicating a further decline for the pair.
Note: The period and prices of the moving averages are based on the author's H1 chart and differ from the classic daily moving averages on the D1 chart.
Bollinger Bands In case of a decline, the lower boundary of the indicator near 1.3386 will act as support.
Indicator Descriptions:


