আরও দেখুন

 27.06.2025 03:41 AM
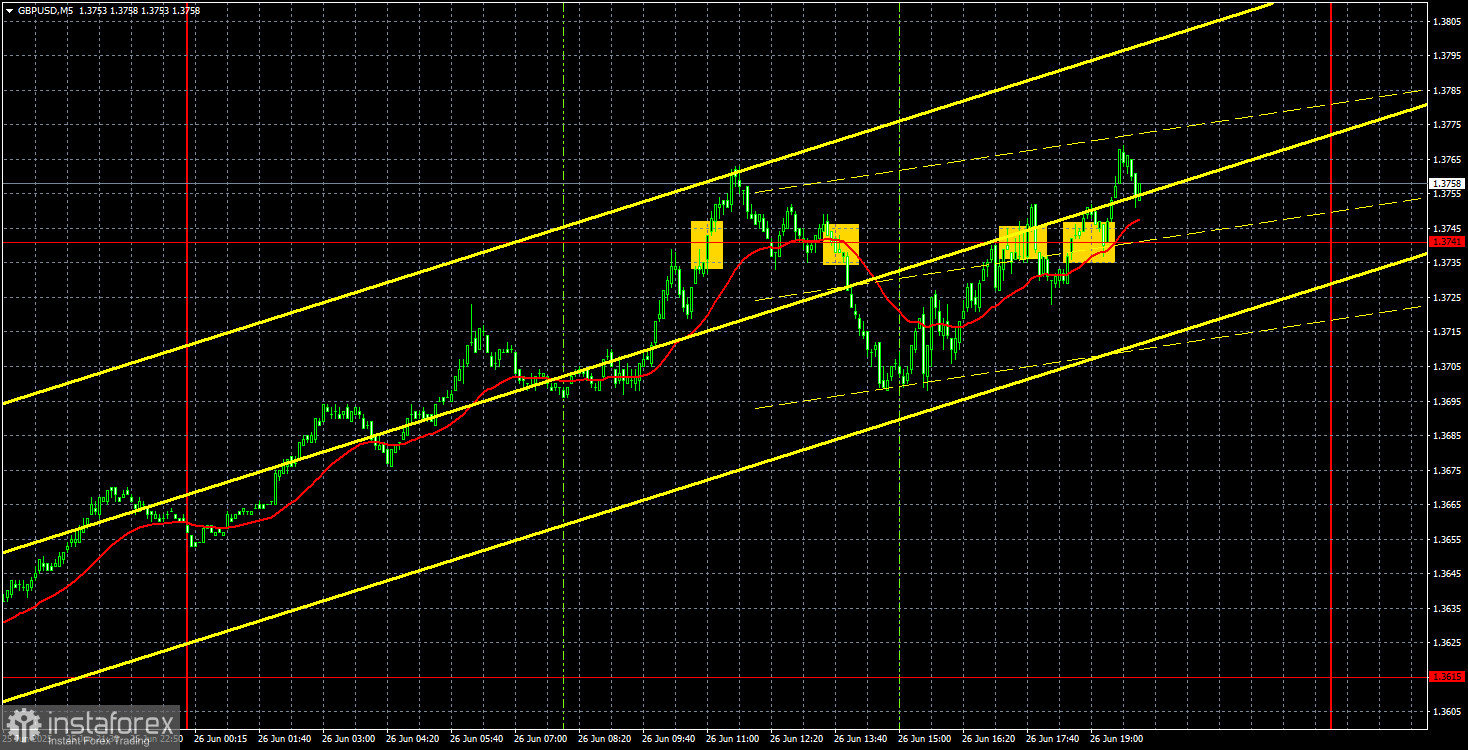
The GBP/USD currency pair continued its upward movement on Thursday, which began back on Monday. Practically without pauses, the British pound surged 350 pips in just four days. And who can say that this latest fall of the U.S. dollar is undeserved?
We have repeatedly pointed out that the global reason behind the dollar's decline is not the daily contradictory statements and bizarre actions of Donald Trump but the Trade War, which began three months ago and shows no signs of ending. Besides the Trade War, there are countless other factors and events prompting market participants to steer clear of the U.S. dollar. These events can be listed endlessly — quite literally.
However, it's not just about fundamental events. Yesterday, for example, the macroeconomic backdrop added more trouble for the dollar. The U.S. economy shrank by 0.5% in Q1, compared to the initial estimate of -0.3% and the second estimate of -0.2%. Thus, Trump can safely list the first quarter of his new presidential term in the "active losses" column. That said, the U.S. President is already blaming Jerome Powell for potential economic troubles in 2025. While Trump previously claimed that the downturn would be short-lived, followed by strong growth and a bright future, the clouds over America continue to thicken. Then again, Trump could claim at any moment that his remarks about a "short-term recession" were ironic — just like when he once said the Russia–Ukraine conflict could be ended in 24 hours.
On the 5-minute timeframe, several signals were generated yesterday, but the last growth wave had already started on Wednesday evening. There were no levels along the price's upward path from which to open long positions. The British pound has not traded this high in years. The last time it approached $1.40 was in 2022 during a long-standing 16-year downward trend.
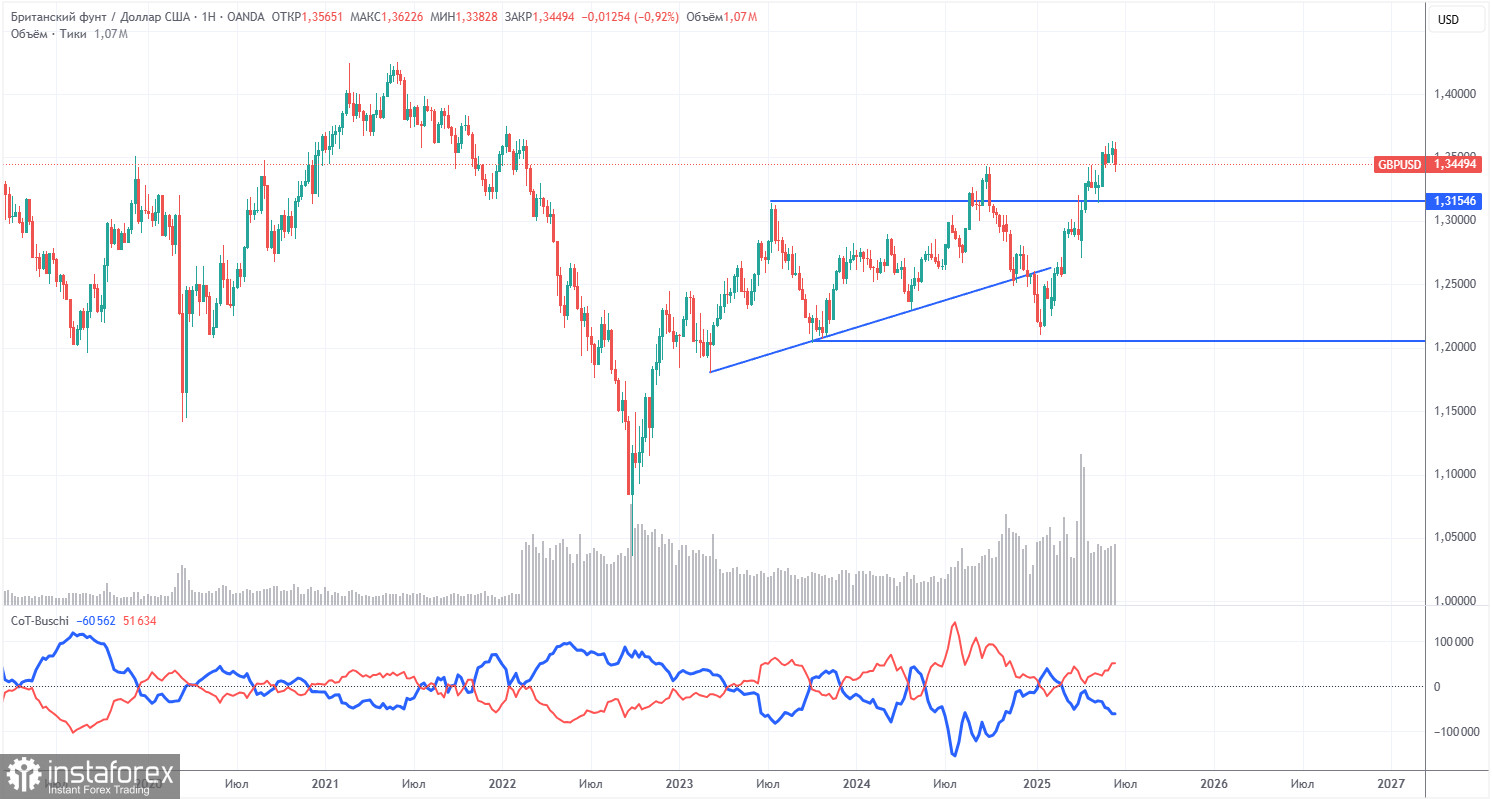
COT reports for the British pound show that commercial traders' sentiment has fluctuated frequently in recent years. The red and blue lines, representing net positions of commercial and non-commercial traders, often intersect and usually hover near zero. They also remain close now, indicating an approximately equal number of long and short positions. However, over the past 18 months, the net position has been trending upward.
The dollar continues to weaken due to Donald Trump's policies, so the current interest of market makers in the pound isn't particularly relevant. If the global trade war begins to de-escalate, the U.S. dollar may have a chance to strengthen. According to the latest report on the British pound, the "Non-commercial" group opened 7,400 new long contracts and closed 9,000, resulting in a weekly net increase of 16,400 contracts—a notable shift.
The pound has risen sharply lately, but it's important to remember that the primary reason is Trump's policy agenda. Once that factor is neutralized, the dollar could start to gain again—but no one knows when that will happen. The dollar is still in the early stages of Trump's presidency. What further shocks await over the next four years?
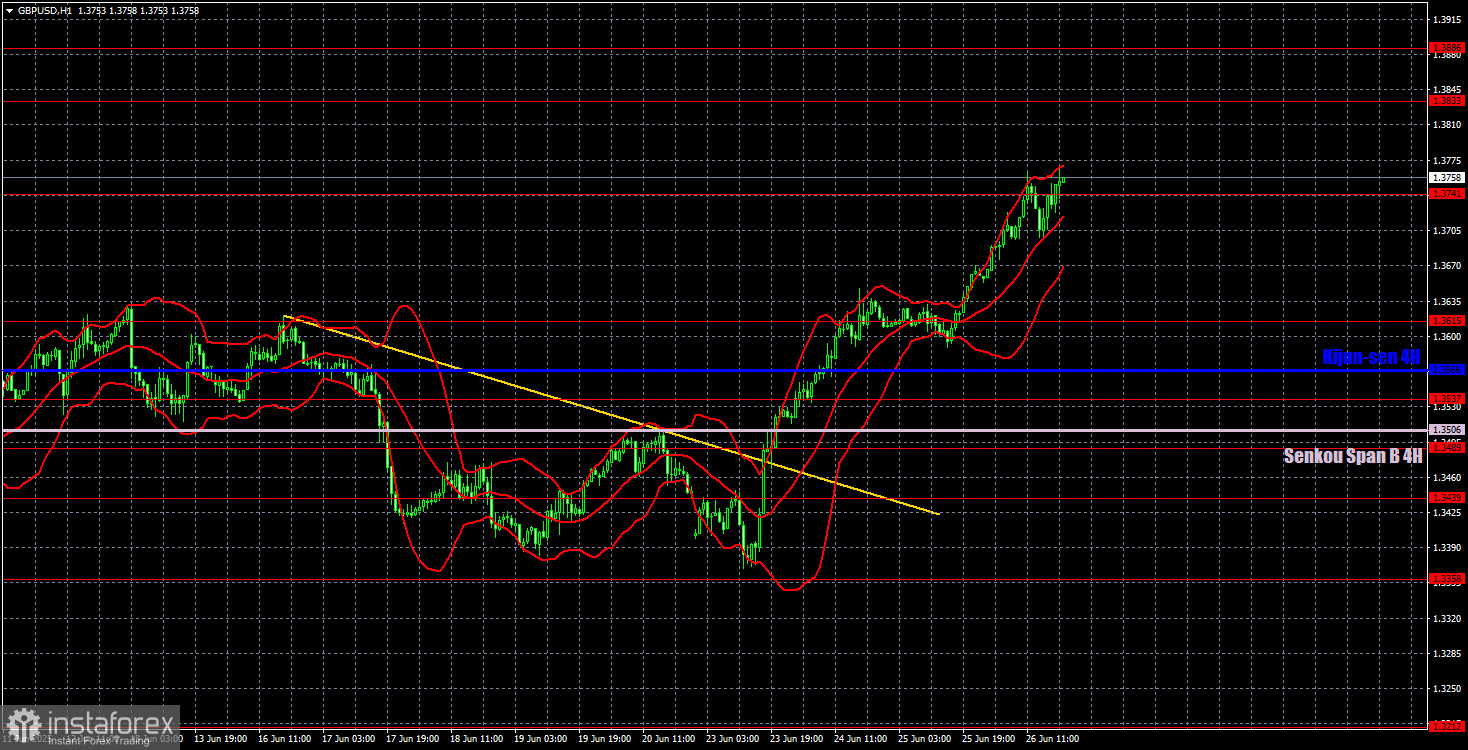
On the hourly timeframe, the GBP/USD pair broke through the trendline and surpassed the 1.3615 level, reaching 1.3741. For a few days, the market remained stagnant as it awaited new negative or sensational news from the U.S. It then resumed buying the pound and selling the dollar. As we can see, it's not always necessary to have any news at all for the dollar to keep falling. And right now, virtually any news out of the U.S. is a reason to sell the dollar.
For June 27, we highlight the following important levels: 1.3212, 1.3288, 1.3358, 1.3439, 1.3489, 1.3537, 1.3615, 1.3741, 1.3833, 1.3886. The Senkou Span B line (1.3506) and the Kijun-sen line (1.3566) can also serve as signal sources. The Stop Loss level is recommended to be moved to breakeven after a 20-pip move in the correct direction. The Ichimoku indicator lines may shift throughout the day and should be taken into account when determining trade signals.
On Friday, there are no scheduled events in the UK, and in the U.S., several reports are expected to be released, which — as everyone understands — are unlikely to affect the current trend or the market's desire to continue dumping the U.S. dollar. At most, only a local market reaction is possible.


