আরও দেখুন

 30.06.2025 10:40 AM
This week, the market may start declining from the 1.1718 level (the closing of the last weekly candle), targeting 1.1652 — the 14.6% retracement level (blue dashed line). Upon testing this level, the price may reverse upward toward 1.1709 — the historical resistance level (blue dashed line).
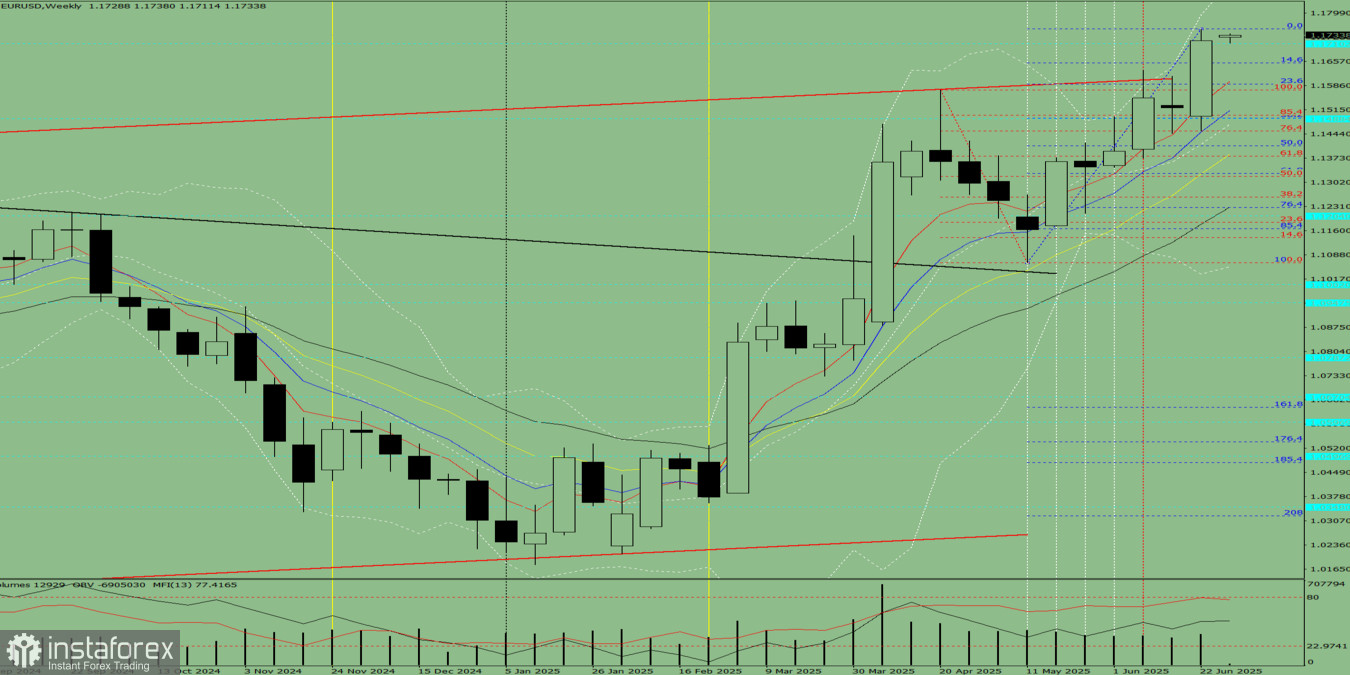
Fig. 1 (Weekly Chart)
Conclusion based on comprehensive analysis: downward movement
The price is most likely to exhibit a bearish trend throughout the week, with no upper shadow on the weekly black candle (indicating downward movement on Monday), and a lower shadow appearing by Friday (indicating a potential upward move at the end of the week).
From the 1.1718 level (closing of the last weekly candle), the pair may begin a downward movement toward 1.1590 — the 23.6% retracement level (blue dashed line). Upon testing this level, the price may rebound upward toward 1.1652 — the 14.6% retracement level (blue dashed line).
You have already liked this post today
*এখানে পোস্ট করা মার্কেট বিশ্লেষণ আপনার সচেতনতা বৃদ্ধির জন্য প্রদান করা হয়, ট্রেড করার নির্দেশনা প্রদানের জন্য প্রদান করা হয় না।


