আরও দেখুন

 09.07.2025 07:47 AM
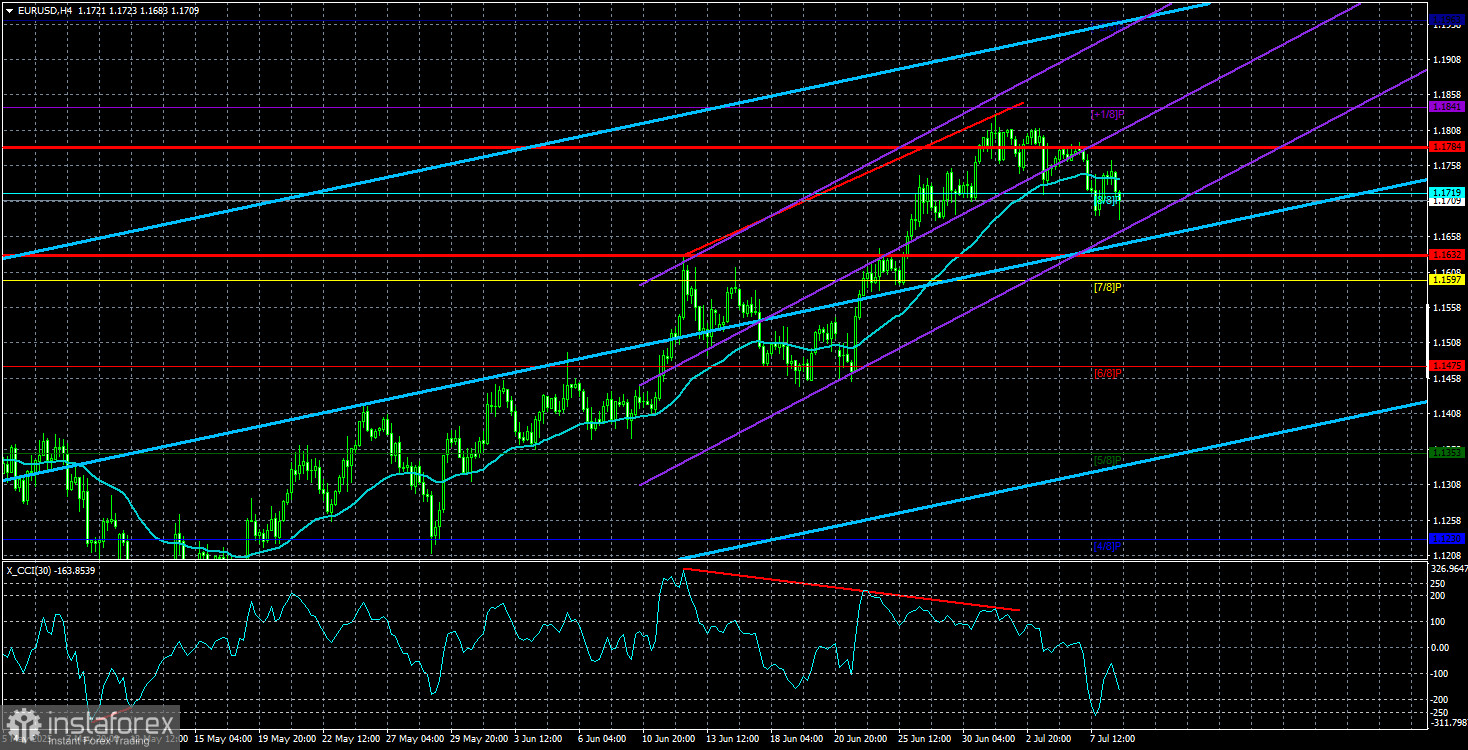
The EUR/USD currency pair maintained a corrective tone throughout Tuesday. There were no macroeconomic events that day, but Donald Trump "listed" all the countries for which tariffs will be raised starting August 1. As discussed previously, Trump decided not to raise tariffs from June 10 but rather from August 1. This kind of "strategic move" is aimed at "giving partners additional time to reconsider." It seems likely that if trade agreements are not signed by August 1, Trump will initiate another similar move.
Trump needs funding. Who provides it is irrelevant. It's widely understood that import tariffs will ultimately be paid not by the exporting countries but by American consumers purchasing these goods. Exporting nations will likely suffer some losses due to reduced demand for their goods in the world's largest market, but they won't be the ones bearing the direct costs of Trump's tariffs.
Accordingly, Trump will do whatever it takes to bring additional revenue into the budget. Whether through tariffs or trade deals, the end result is similar since both involve tariffs. The only difference lies in the rate. From the dollar's perspective, both options are unfavorable.
Still, trade agreements are a more attractive option for Trump. First, they serve as justification for higher prices on imported goods. If U.S. consumers raise concerns about price increases, Trump can point to the trade deals and suggest that the terms were mutually agreed upon—deflecting sole responsibility. In other words, he wants a scapegoat.
Second, regardless of the approach, prices in the U.S. are rising. Inflation is already underway, and Trump must recognize that higher prices, combined with reduced social and healthcare programs and only a formal tax reduction, could severely impact his chances in the next election. While U.S. law prohibits a third presidential term, it's highly probable that Trump would want to remain in the White House beyond the next four years. One possible scenario is a victory by J.D. Vance, followed by Trump becoming vice president. If Vance resigns "due to health reasons," Trump could return as president for a third term.
Thus, Trump needs a strong electoral base to ensure his party wins the next election. Notably, he may not only be competing against Democrats but also against Elon Musk's political movement. Musk currently enjoys comparable popularity to Trump in the U.S. As a result, if a peaceful resolution is available, Trump will likely choose that path—provided it doesn't compromise his interests. That explains the extension of the "grace period." After August 1, Trump could raise tariffs again, possibly from September 1—and continue to do so indefinitely.
Average Volatility
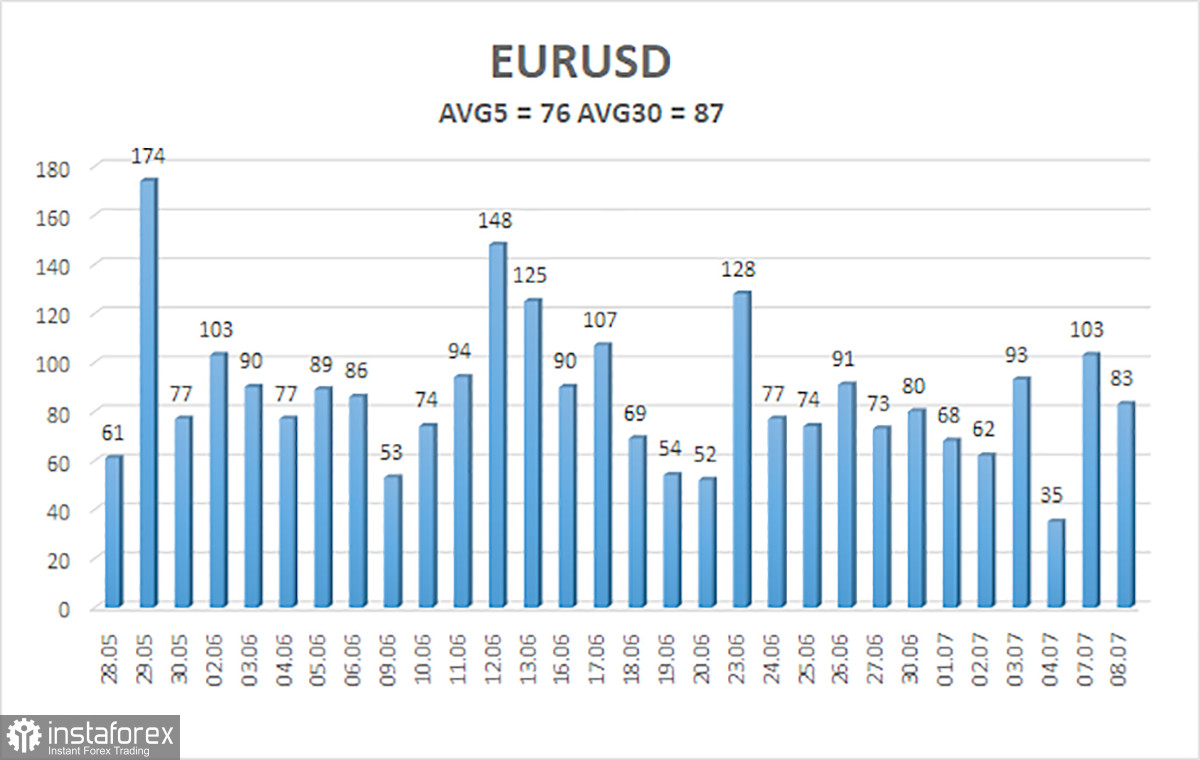
As of July 9, the average volatility of the EUR/USD currency pair over the last five trading days is 76 points, which is considered "moderate." We expect movement within the range of 1.1632 to 1.1784 on Wednesday. The senior linear regression channel points upward, indicating a continuing uptrend. The CCI indicator entered the overbought zone and formed several bearish divergences, triggering the current downward correction.
Nearest Support Levels:
Nearest Resistance Levels:
Trade Recommendations:
The EUR/USD pair continues to follow an upward trend. Donald Trump's policies—both domestic and international—continue to exert significant pressure on the U.S. dollar. The market still shows no interest in buying the dollar under current conditions. If the price drops below the moving average, short positions with a target at 1.1632 may be considered, but a steep decline remains unlikely. Above the moving average, long positions with a target at 1.1841 remain relevant.
Illustration Notes:


