আরও দেখুন

 14.07.2025 04:33 AM
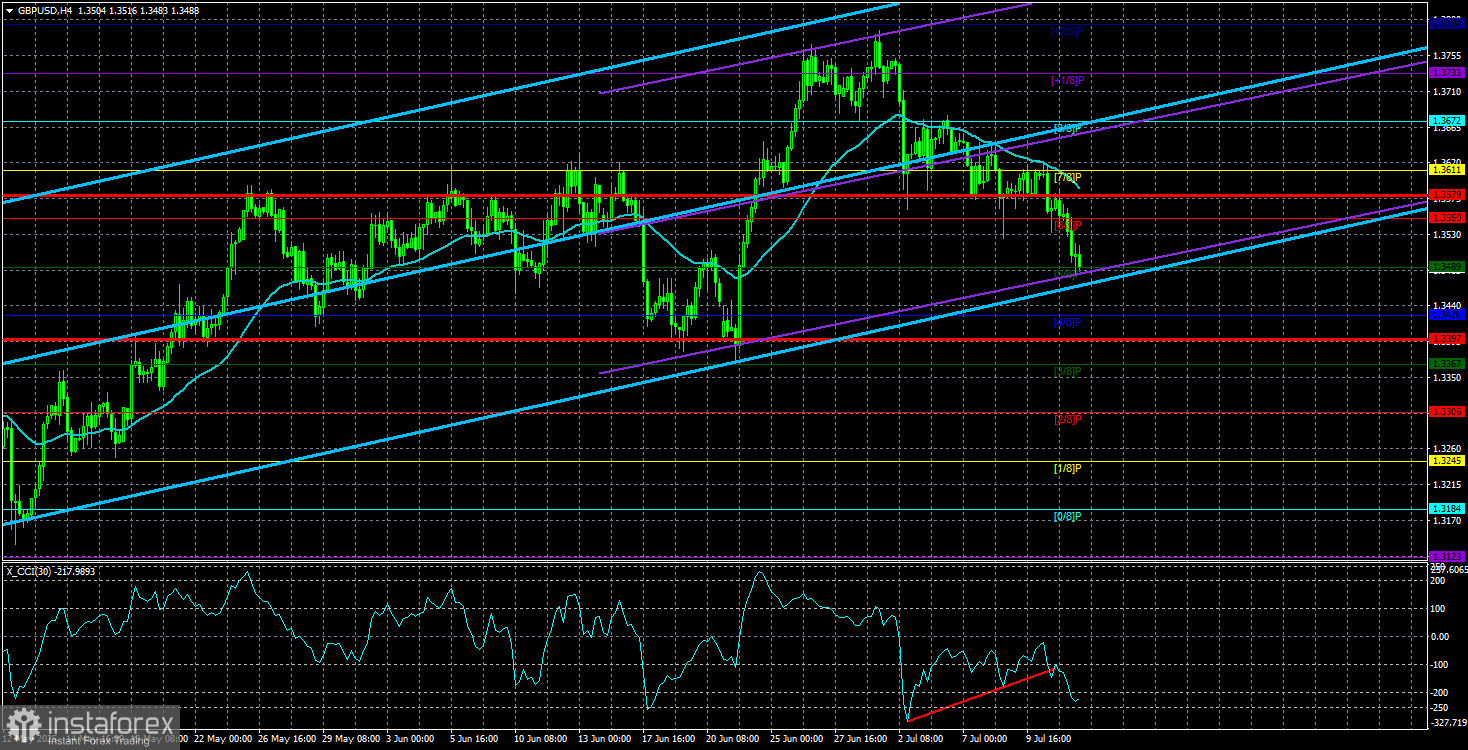
The GBP/USD currency pair showed a rather significant decline on Friday. Overall, the British currency has been falling for two weeks now, and this is a very important fact that will help us correctly assess the current market picture.
So, the British pound has been declining for 10 business days. Why? Last week, the UK released exactly two reports (on Friday), and both disappointed. It would seem everything is clear—the pound is falling due to disappointing macroeconomic data in the UK. But why then did the pound fall on Monday, Tuesday, Wednesday, and Thursday? Yes, the decline wasn't fast or sharp. But it was still a decline. Let us remind you that every day last week, Trump announced new tariffs, increased existing ones, continued criticizing Jerome Powell, and threatened half the world. If the dollar used to fall on such news, why is it rising now? We believe the pound is undergoing the same kind of correction as the euro—a purely technical one. The pound is falling more sharply than the euro simply because it has always been a more volatile currency.
Over two weeks, the euro has declined by 150 points, while the pound has fallen by 300. If we exclude the day when Rachel Reeves' tears in the British Parliament triggered a drop, we get a 230–240 point decline for the pound, entirely comparable to the euro's fall.
As for Friday's reports, since when does the British pound fall 100 points on a monthly GDP report? The deviation from the forecast was not significant—a 0.1% decline is minimal, and the industrial production report has been disappointing for a long time. Therefore, we do not believe that these two UK reports triggered Friday's pound drop. It's all part of the same technical correction.
We also draw attention to the pair's behavior on Friday, clearly visible on the 5-minute timeframe. Can we say the fall began after the UK data release? The pound started falling during the night and gradually lost ground throughout the day without any sharp moves. Thus, the GDP and industrial production reports had little to do with it.
We believe the time has come for a correction, and that's precisely why the dollar is rising. The fundamental background has not changed recently, so further declines can be expected on technical grounds. Based on the fundamentals and overall trader sentiment, a resumption of the upward trend should be anticipated. Of course, the correction might take some time, but on the daily timeframe, we can see that this isn't even a proper correction yet. It's just a minor pullback. There have already been four such pullbacks in the last six months. Each time, the British pound then made a strong upward move.
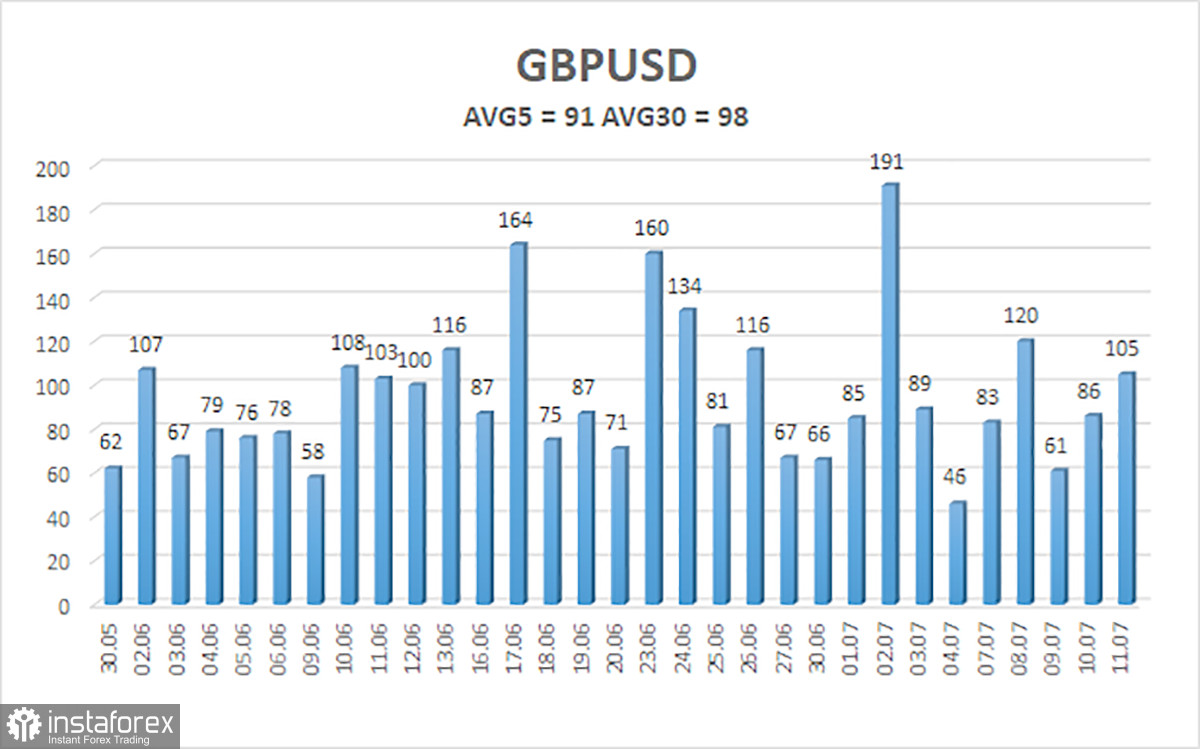
The average volatility of the GBP/USD pair over the past five trading days is 91 pips. For the pound/dollar pair, this value is considered "moderate." On Monday, July 14, we expect movement within the range of 1.3397 to 1.3579. The long-term regression channel is directed upward, indicating a clear uptrend. The CCI indicator has entered the oversold area twice, now pointing to a resumption of the upward trend.
S1 – 1.3489
S2 – 1.3428
S3 – 1.3367
R1 – 1.3550
R2 – 1.3611
R3 – 1.3672
The GBP/USD currency pair continues a weak downward correction, which may soon come to an end. In the medium term, Trump's policies are likely to continue putting pressure on the dollar. Therefore, long positions with targets at 1.3672 and 1.3733 remain relevant if the price consolidates above the moving average. A position below the moving average line allows for small short trades with targets at 1.3489 and 1.3428, but as before, we do not expect strong dollar growth. From time to time, the U.S. currency shows corrective strength, but for a sustained uptrend, it needs real signs that the global trade war is ending.
Linear Regression Channels help determine the current trend. If both channels are aligned, it indicates a strong trend.
Moving Average Line (settings: 20,0, smoothed) defines the short-term trend and guides the trading direction.
Murray Levels act as target levels for movements and corrections.
Volatility Levels (red lines) represent the likely price range for the pair over the next 24 hours based on current volatility readings.
CCI Indicator: If it enters the oversold region (below -250) or overbought region (above +250), it signals an impending trend reversal in the opposite direction.


