আরও দেখুন

 28.07.2025 07:16 PM
This week, the price may begin a downward movement from the 1.3435 level (close of the last weekly candle), targeting 1.3269 – a historical support level (blue dashed line). Upon testing this level, the price may initiate an upward correction toward 1.3410 – the 21-period EMA (thin black line).
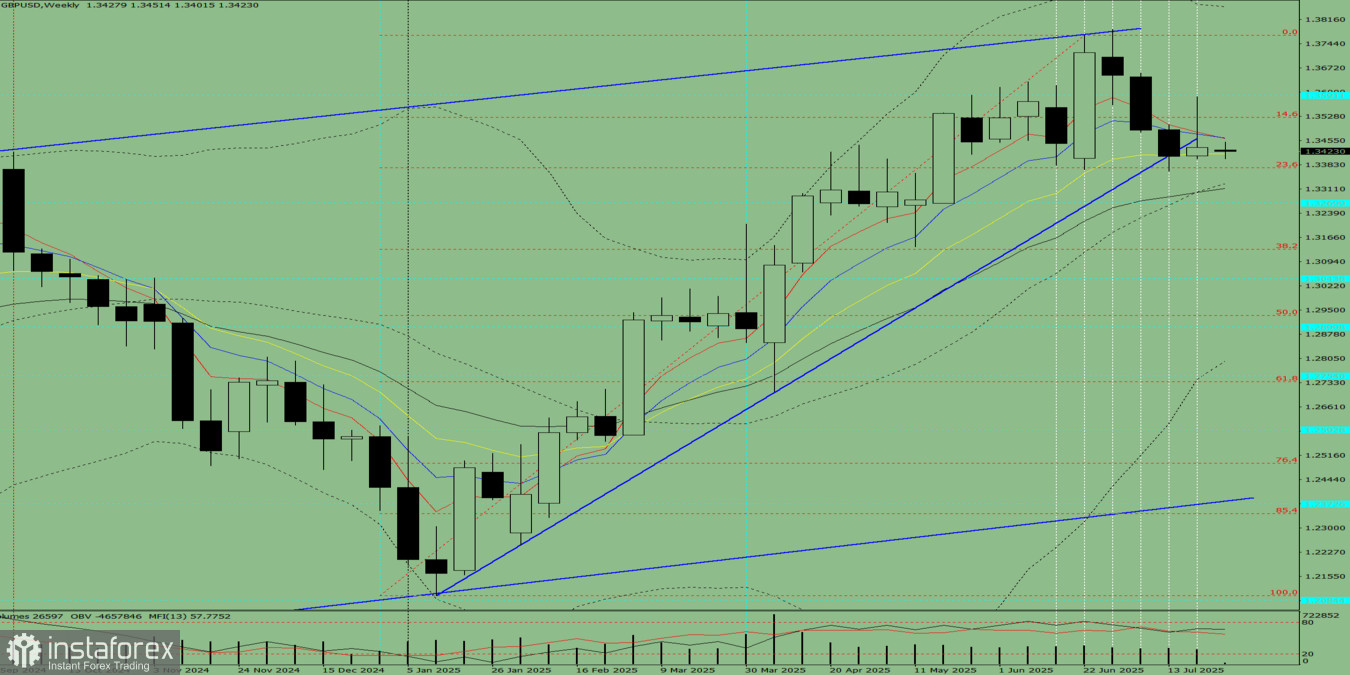
Figure 1 (Weekly Chart)
Conclusion from the Comprehensive Analysis: downward movement.
The price is most likely to trend downward throughout the week, with the weekly black candle lacking an upper shadow (Monday – down), and forming a lower shadow (Friday – up).
The price may begin to move downward from the 1.3435 level (close of the last weekly candle), targeting 1.3131 – the 38.2% retracement level (red dashed line). Upon reaching this level, an upward movement may follow, targeting 1.3270 – a historical support level (blue dashed line).
You have already liked this post today
*এখানে পোস্ট করা মার্কেট বিশ্লেষণ আপনার সচেতনতা বৃদ্ধির জন্য প্রদান করা হয়, ট্রেড করার নির্দেশনা প্রদানের জন্য প্রদান করা হয় না।


