আরও দেখুন

 29.07.2025 12:45 AM
Trends give way to consolidations. Consolidations pave the way for new trends. That's the nature of the market. And Bitcoin is no exception. The inability of the bulls to resume the upward trend in BTC/USD has led to profit-taking by speculators. According to Coinglass, by the end of the week, through July 25, long positions in cryptocurrencies worth $400 million were liquidated. Bitcoin led the way, with net long positions down by $159 million.
Corrections and consolidations are a common occurrence in a bull market. Still, stories about large bets on BTC/USD falling to $110,000 capture the imagination. One anonymous trader paid $5 million in premiums on derivatives betting on a drop in Bitcoin. The total size of the deal is estimated at $600 million.
Rumors that crypto whales are offloading digital assets have pulled BTC/USD away from its all-time highs. But true believers in digital assets remain unfazed. Strategy, Michael Saylor's firm, has devised a new method for raising funds to purchase tokens. It announced the issuance of preferred shares, offering holders a 9% annual return. This high yield is likely to help Strategy further grow its Bitcoin portfolio. Currently, the company owns 3% of all Bitcoin in circulation, with a total value exceeding $70 billion.
The rising global appetite for risk is not helping BTC/USD bulls. U.S. stock indexes continue to hit new all-time highs amid decreasing trade uncertainty, the U.S. economy's resilience to White House tariff policy shocks, and strong Q2 corporate earnings. Around 83% of S&P 500 companies that have reported earnings have exceeded expectations, compared to a 10-year average of 75%. The U.S. trade deals with Japan and the European Union are benefiting the equity market—but not cryptocurrencies.
Nevertheless, the number of optimists buying the dips hasn't diminished. And it's not just about Michael Saylor's Strategy. Citigroup forecasts that BTC/USD will rise to $135,000 by year-end. Given the favorable backdrop for risk assets, this scenario seems quite plausible. Still, a healthy correction for Bitcoin wouldn't be a bad thing. The question is—when will it begin?
Perhaps clues will come from the week ending August 1. The Fed's meeting, along with U.S. GDP, inflation, and labor market data releases, will likely shed more light on the economic outlook. How will U.S. stock indexes and digital assets react? Time will tell.
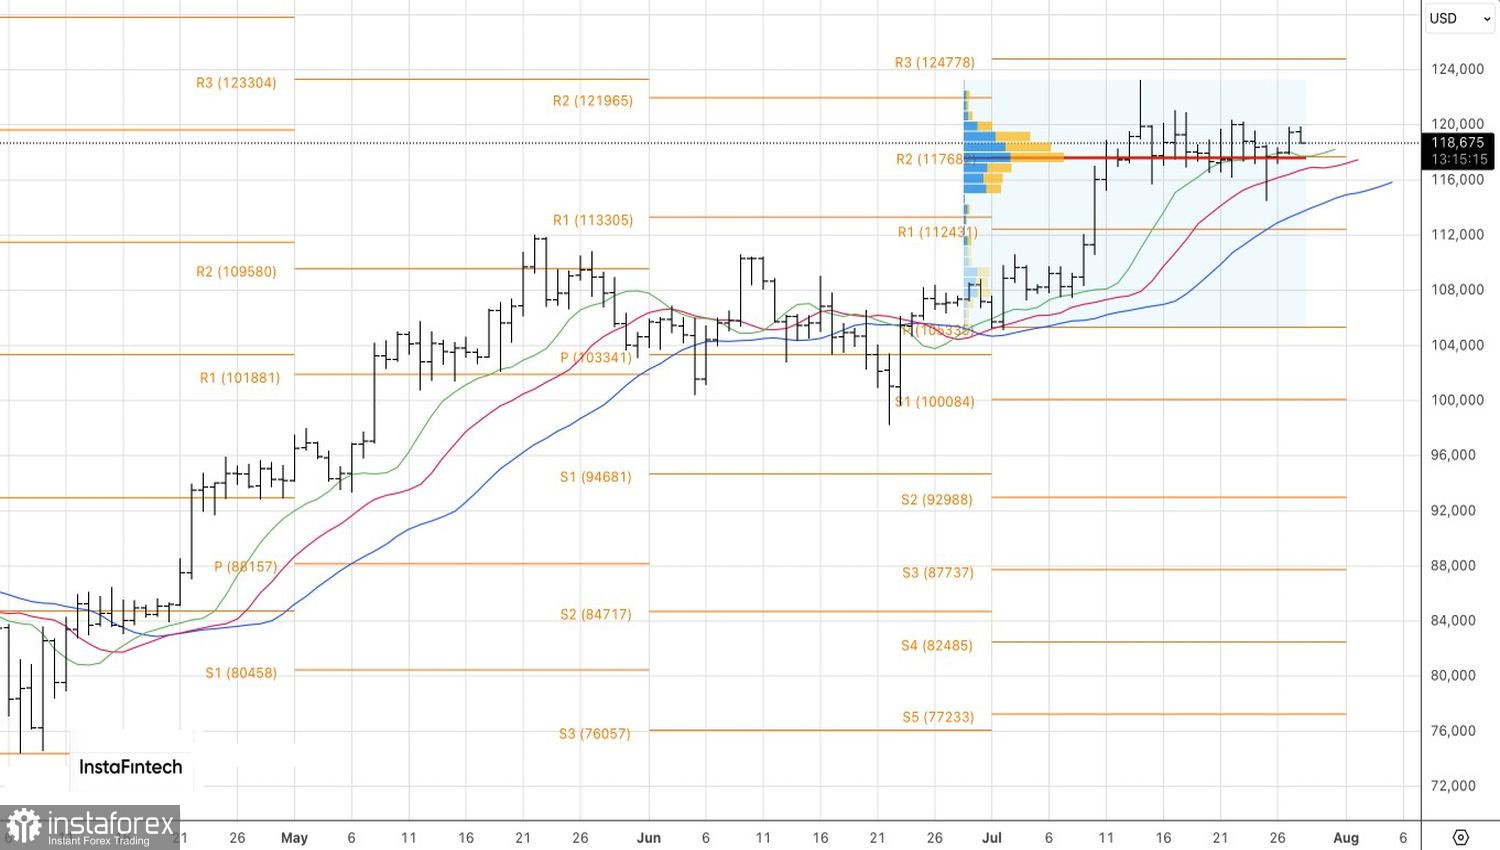
From a technical perspective, BTC/USD on the daily chart is consolidating within the 116,000–120,000 range, forming a "Spike and Ledge" pattern. Although previous breakouts of the upper and lower boundaries have turned out to be false, it may still be worth taking another shot. Selling for $116,000 and buying for $120,000 remain valid strategies.


