আরও দেখুন

 08.08.2025 10:25 AM
Trend analysis (Fig. 1).
On Friday, from the level of 1.1664 (yesterday's daily candle close), the market may start moving downward toward 1.1626 — the 23.6% retracement level (blue dashed line). Upon testing this level, the price may resume upward movement toward 1.1698 — the upper fractal (blue dashed line).
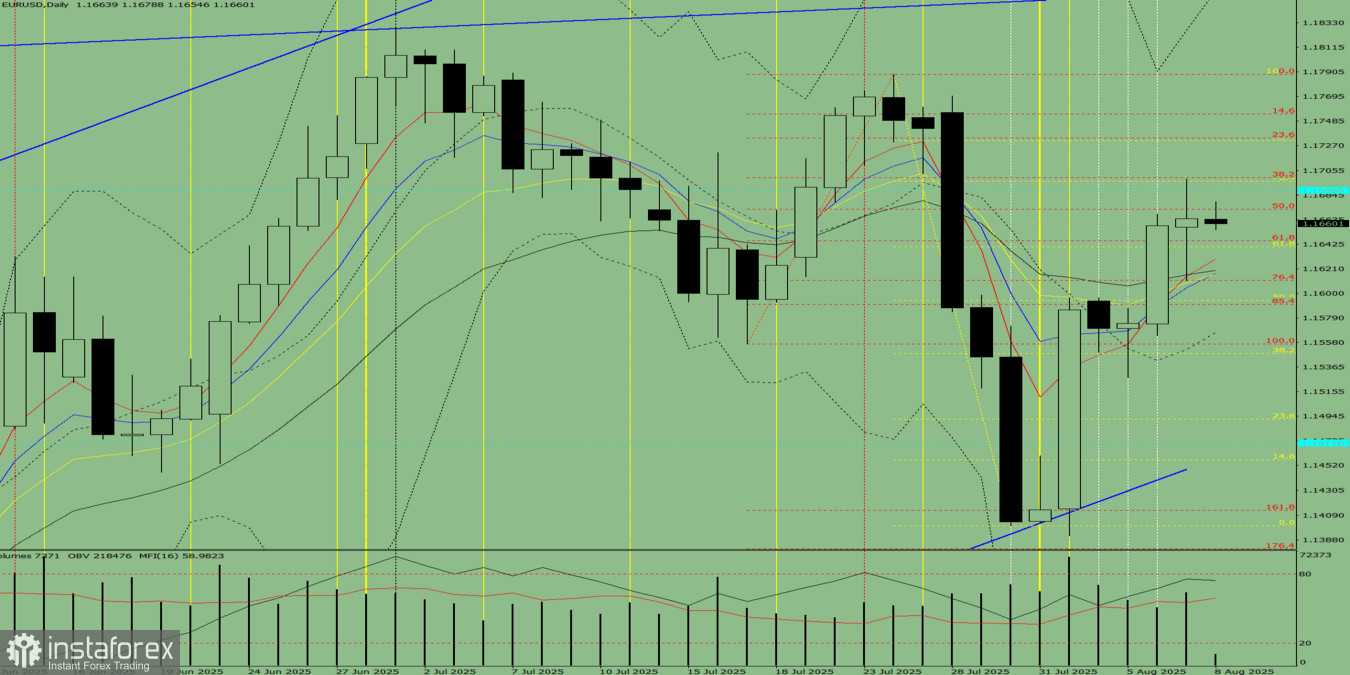
Fig. 1 (daily chart).
Comprehensive analysis:
Overall conclusion: Downward trend.
Alternative scenario: Today, from the level of 1.1664 (yesterday's daily candle close), the price may start moving downward toward 1.1618 — the 21-period EMA (thin black line). Upon testing this line, a retracement upward toward 1.1698 — the upper fractal (blue dashed line) — is possible.
You have already liked this post today
*এখানে পোস্ট করা মার্কেট বিশ্লেষণ আপনার সচেতনতা বৃদ্ধির জন্য প্রদান করা হয়, ট্রেড করার নির্দেশনা প্রদানের জন্য প্রদান করা হয় না।


