আরও দেখুন

 25.08.2025 11:08 AM
Trend Analysis (Fig. 1).
This week, from the level of 1.1720 (the close of the last weekly candle), the market may continue moving upward with the target at 1.1828 – the upper fractal (blue dotted line). Upon testing this level, the price may pull back downward with the target at 1.1717 – the 14.6% retracement level (blue dotted line).
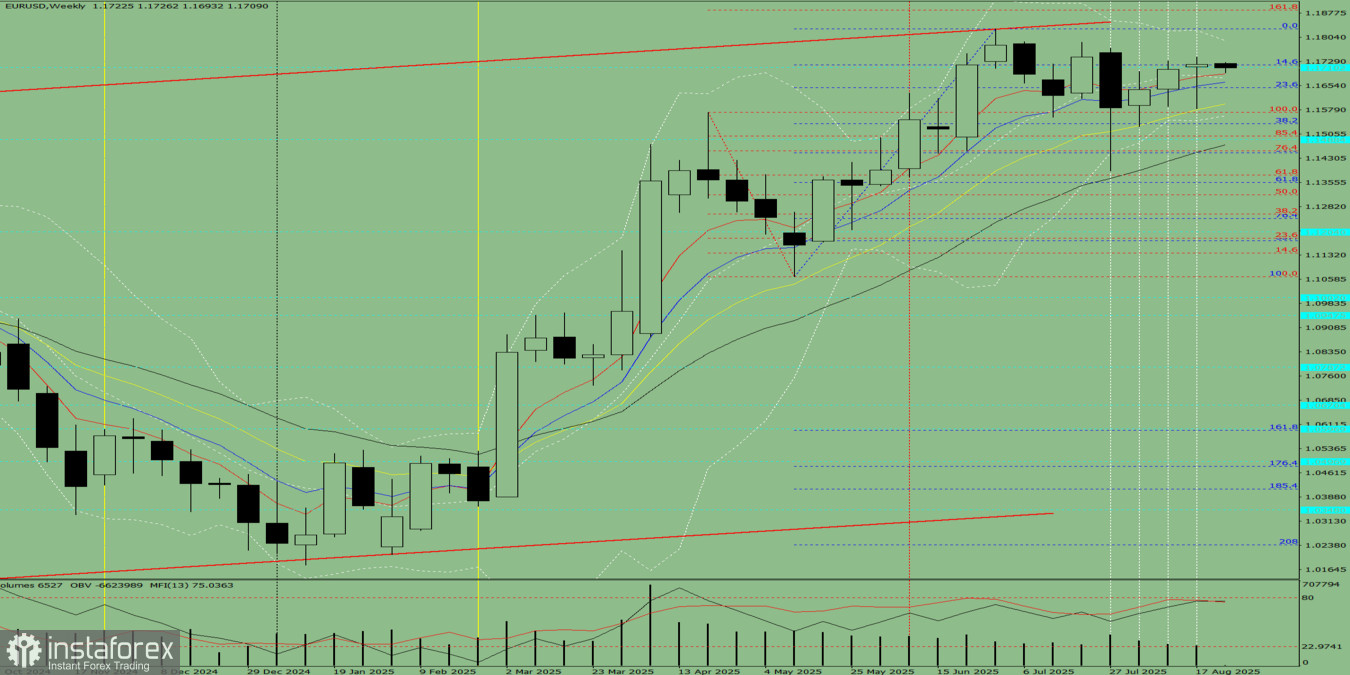
Fig. 1 (weekly chart).
Comprehensive Analysis:
Conclusion from comprehensive analysis: upward trend.
Overall result for the EUR/USD weekly chart candle: The price during the week is most likely to follow an upward trend, with no lower shadow on the weekly white candle (Monday – upward) and the presence of an upper shadow (Friday – downward).
Alternative Scenario: From the level of 1.1720 (the close of the last weekly candle), the pair may continue upward movement with the target at 1.1886 – the 161.8% target level (red dotted line). Upon testing this level, the price may pull back downward with the target at 1.1828 – the upper fractal (blue dotted line).
You have already liked this post today
*এখানে পোস্ট করা মার্কেট বিশ্লেষণ আপনার সচেতনতা বৃদ্ধির জন্য প্রদান করা হয়, ট্রেড করার নির্দেশনা প্রদানের জন্য প্রদান করা হয় না।


