আরও দেখুন

 26.08.2025 09:46 AM
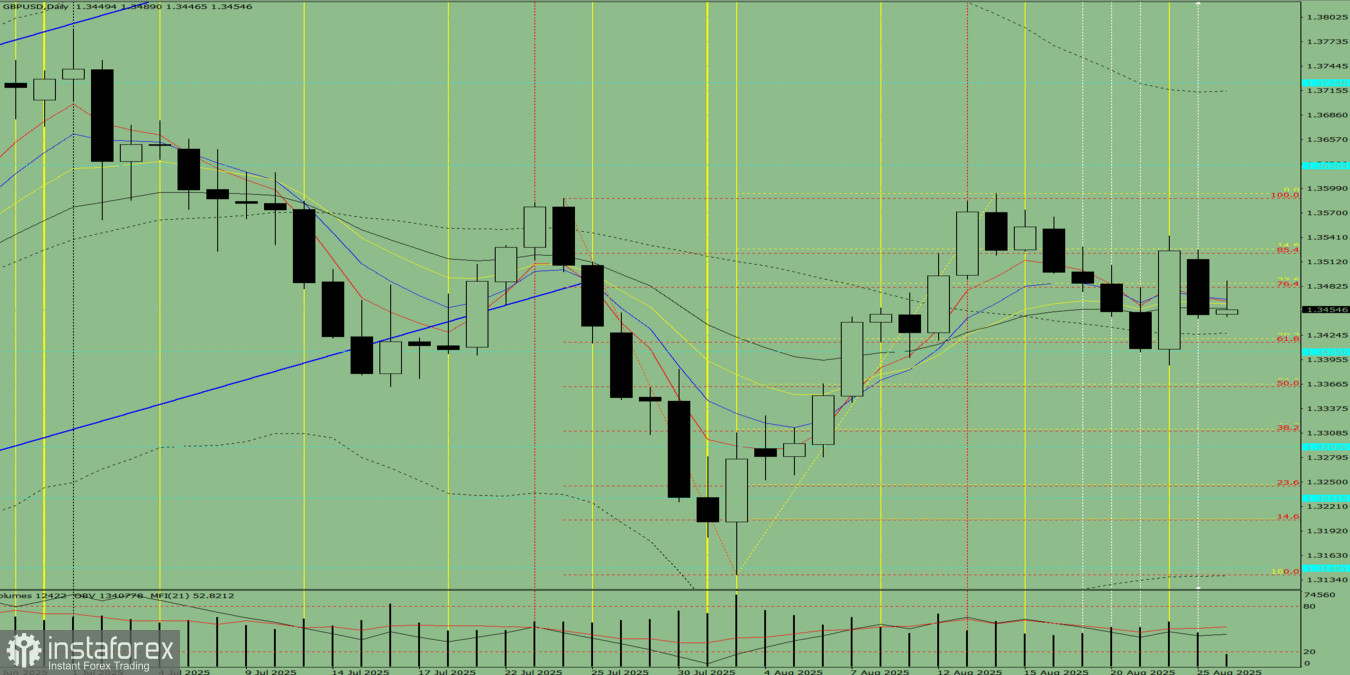
Trend Analysis (Fig. 1).
On Tuesday, from the level of 1.3449 (yesterday's daily close), the market may continue moving downward toward 1.3405 – the historical support level (blue dotted line). Upon testing this level, the price may begin moving upward toward 1.3420 – the 38.2% retracement level (yellow dotted line).
Comprehensive Analysis:
General Conclusion: Downward trend.
Alternative Scenario: From the level of 1.3449 (yesterday's daily close), the price may continue moving downward toward 1.3363 – the 50% retracement level (red dotted line). Upon testing this level, the price may then begin moving upward toward 1.3405 – the historical support level (blue dotted line).
You have already liked this post today
*এখানে পোস্ট করা মার্কেট বিশ্লেষণ আপনার সচেতনতা বৃদ্ধির জন্য প্রদান করা হয়, ট্রেড করার নির্দেশনা প্রদানের জন্য প্রদান করা হয় না।


