আরও দেখুন

 10.09.2025 11:04 AM
On the hourly chart, the GBP/USD pair on Tuesday rebounded from the 100.0% Fibonacci retracement level – 1.3587, turned in favor of the U.S. currency, and began a decline toward the 76.4% Fibonacci level – 1.3482. Today, the pair is stuck between two important levels, so the formation of new signals will depend on which direction the price moves during the day.
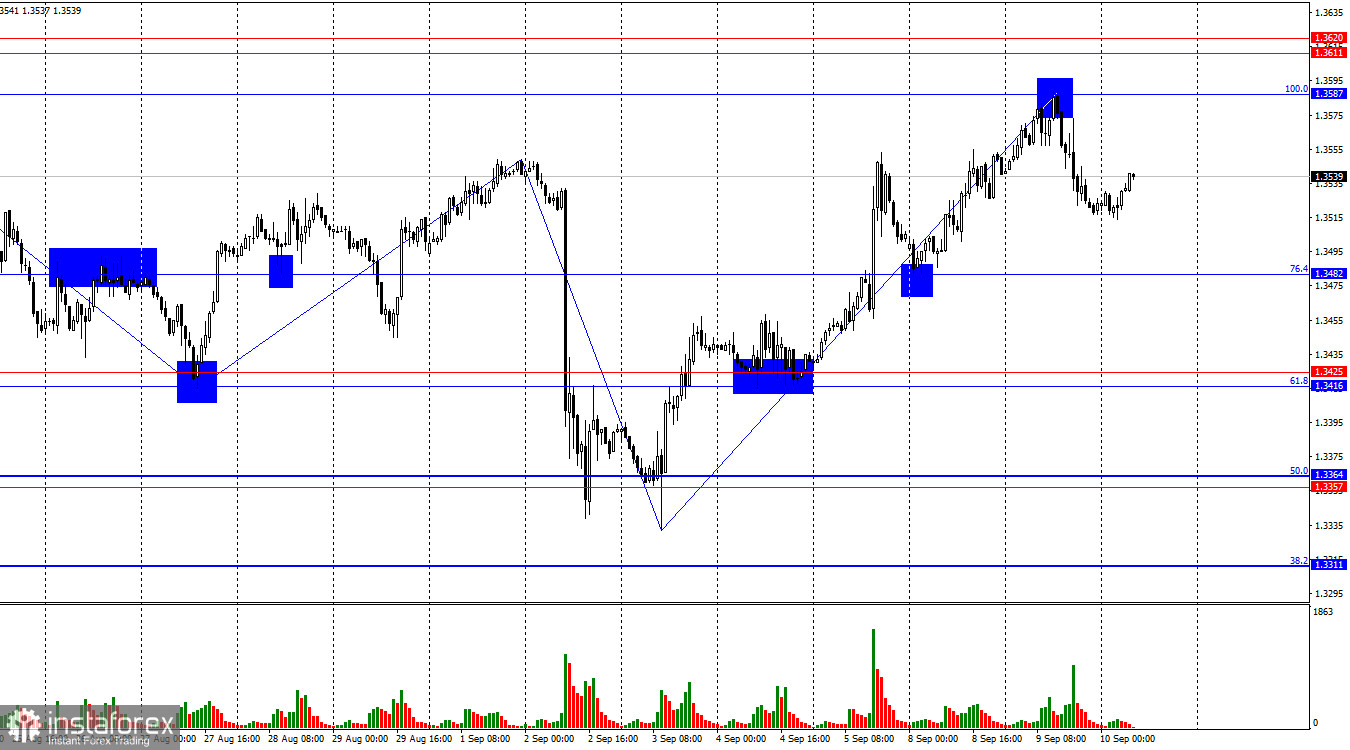
The wave situation continues shifting toward "bullish." The last completed downward wave broke through two previous lows, while the new upward wave broke through the last two peaks. Thus, it can currently be considered that a new "bullish" trend is starting after more than two months of bearish dominance. That dominance turned out to be very weak, since the news background in most cases did not support the bears.
On Tuesday, traders could trade under the influence of only one event – the annual Nonfarm Payrolls report. Few market participants expected this report to show a positive result. The number of jobs was revised down by -911,000 for the past year. However, traders did not seem too upset. The previous value had also been revised down by -818,000, which is a fairly normal occurrence. Recall that the U.S. Bureau of Labor Statistics almost always adjusts monthly reports in the following month or even two months later. Thus, the decline in the actual number of jobs created surprised no one. However, the U.S. dollar still strengthened during the day for unclear reasons. I do not think its growth was tied to the inflation reports due today and tomorrow. Most likely, we saw a typical corrective pullback, as the price had been rising for four consecutive days before Tuesday. In this case, the upward move could resume later this week.
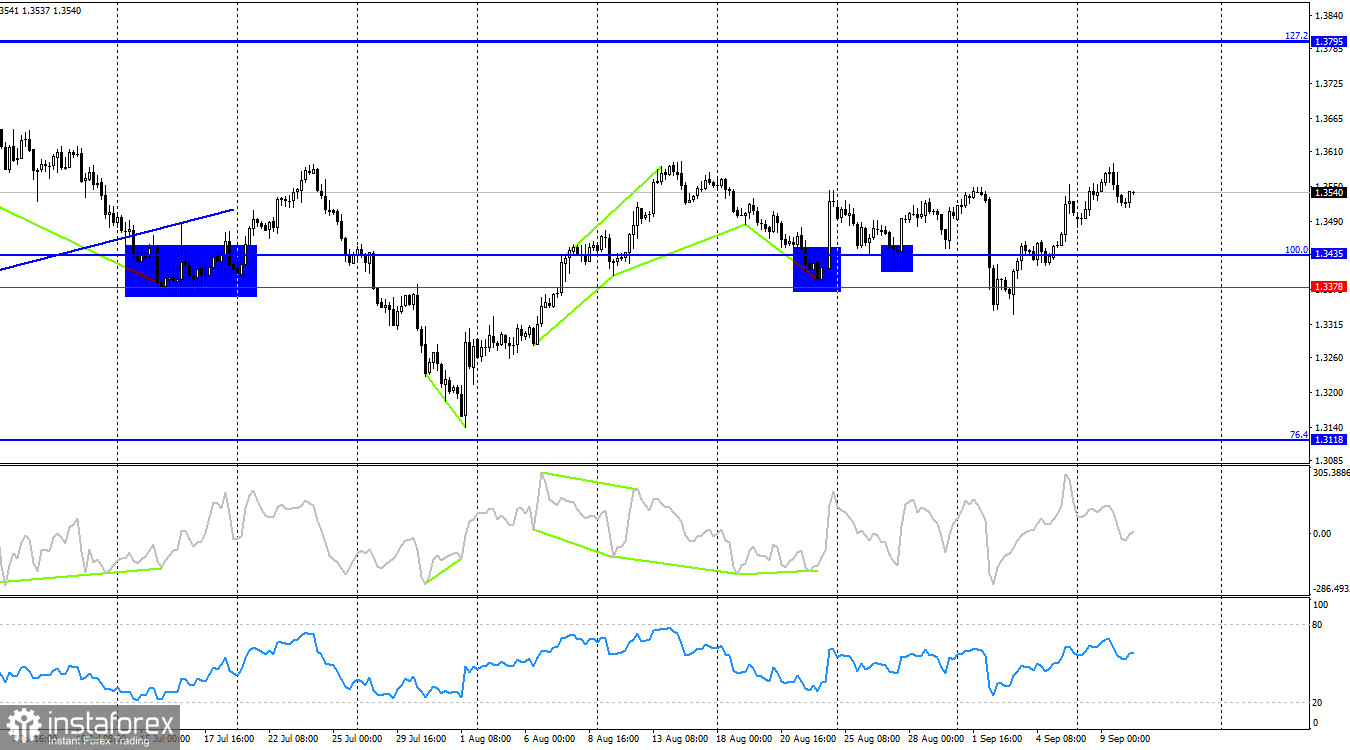
On the 4-hour chart, the pair turned in favor of the pound and consolidated above the 1.3378–1.3435 zone. Thus, the upward process may continue toward the next 127.2% Fibonacci retracement level – 1.3795. The chart pattern is currently mixed, with traders moving the pair in both directions. At the moment, I would recommend paying closer attention to the hourly chart. No emerging divergences are visible on any indicator.
Commitments of Traders (COT) Report:
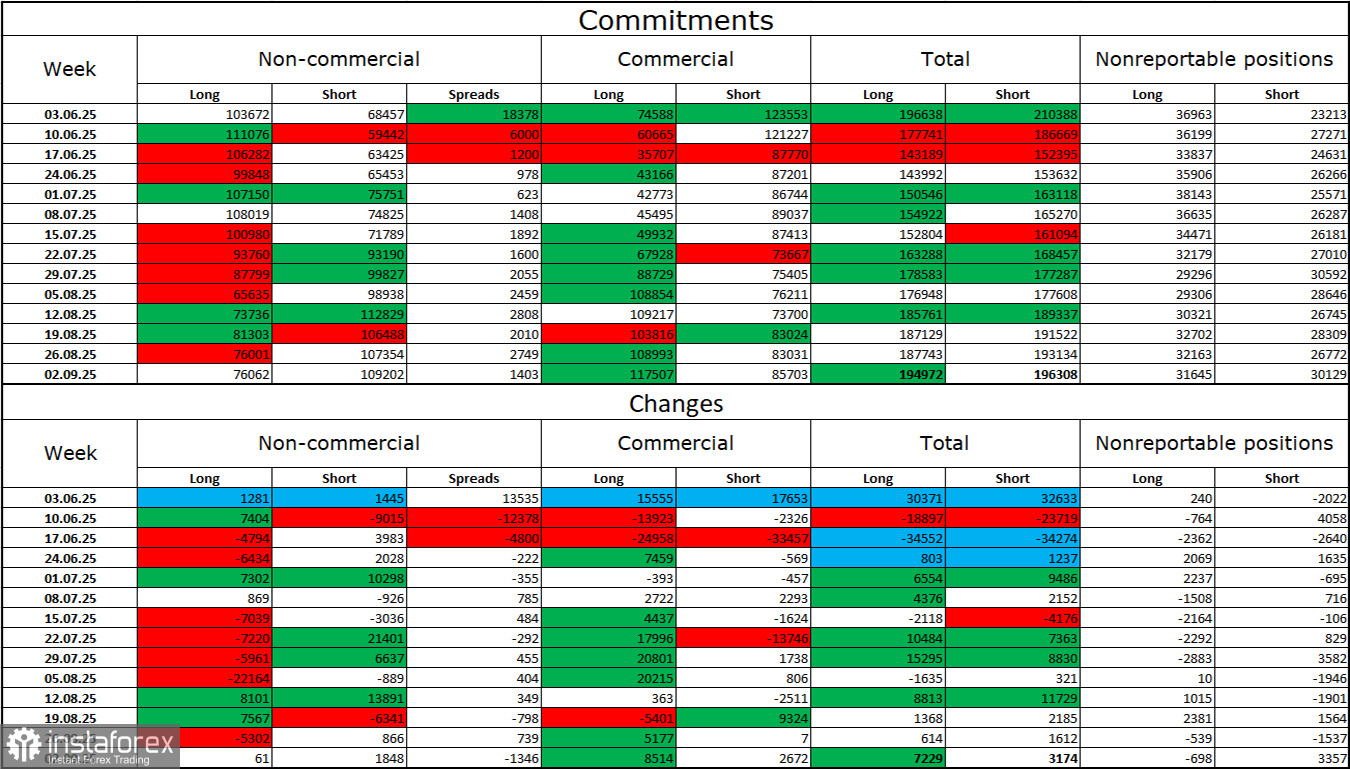
The sentiment of the "Non-commercial" category of traders in the latest reporting week became slightly more "bearish." The number of long positions held by speculators increased by 61, while the number of short positions rose by 1,848. The gap between long and short positions now stands at roughly 76,000 versus 109,000. But as we can see, the pound remains inclined to rise, and traders continue buying.
In my view, the pound still has room to fall. The news background for the dollar was terrible in the first six months of the year but is slowly beginning to improve. Trade tensions are easing, key deals are being signed, and the U.S. economy in Q2 will recover thanks to tariffs and various investments in the country. At the same time, the Fed's easing prospects for the second half of the year are already creating strong pressure on the dollar, with the U.S. labor market weakening and unemployment rising. Therefore, I still see no basis for a "dollar trend."
News calendar for the U.S. and UK:
U.S. – Producer Price Index (12:30 UTC).
On September 10, the economic calendar contains only one entry. The impact of the news background on market sentiment on Wednesday may be limited.
GBP/USD forecast and trading advice:
Selling the pair was possible yesterday after the rebound from 1.3587 on the hourly chart with a target at 1.3482. I am not sure the decline will continue, so it is best to move the Stop Loss to breakeven. Buying is possible today on a rebound from 1.3482 or on a close above the 1.3611–1.3620 zone.
Fibonacci grids are built from 1.3586–1.3139 on the hourly chart and from 1.3431–1.2104 on the 4-hour chart.


