আরও দেখুন

 15.09.2025 11:41 AM
Trend analysis (Fig. 1).
On Monday, from the level of 1.1734 (the closing of Friday's daily candle), the market may continue upward toward 1.1788 – the upper fractal (yellow dashed line). Upon reaching this level, a downward move toward 1.1747 – the upper fractal (daily candle of September 12, 2025) – is possible.
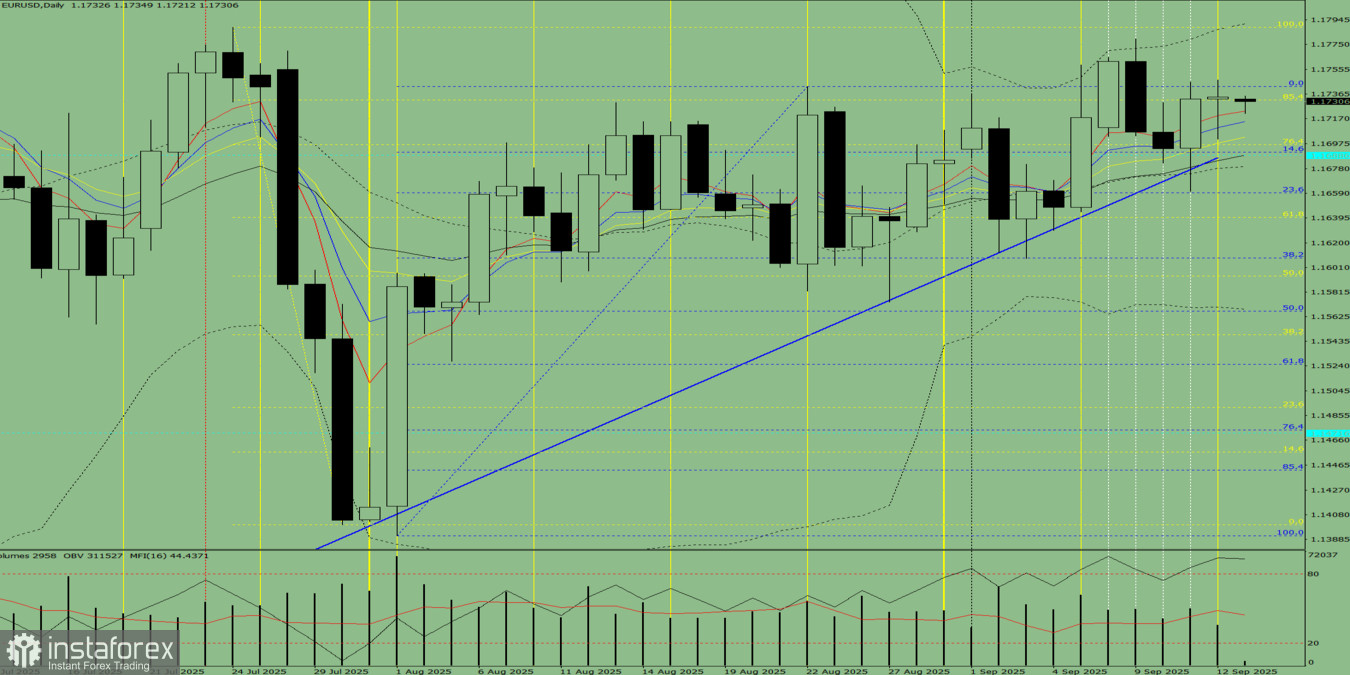
Fig. 1 (daily chart).
Comprehensive analysis:
Overall conclusion: upward trend.
Alternative scenario: from the level of 1.1734 (the closing of Friday's daily candle), the price may continue upward toward 1.1747 – the upper fractal (daily candle of September 12, 2025). Upon reaching this level, a pullback downward toward 1.1697 – the 76.4% retracement level (yellow dashed line) – is possible.
You have already liked this post today
*এখানে পোস্ট করা মার্কেট বিশ্লেষণ আপনার সচেতনতা বৃদ্ধির জন্য প্রদান করা হয়, ট্রেড করার নির্দেশনা প্রদানের জন্য প্রদান করা হয় না।


