আরও দেখুন

 16.09.2025 03:49 AM
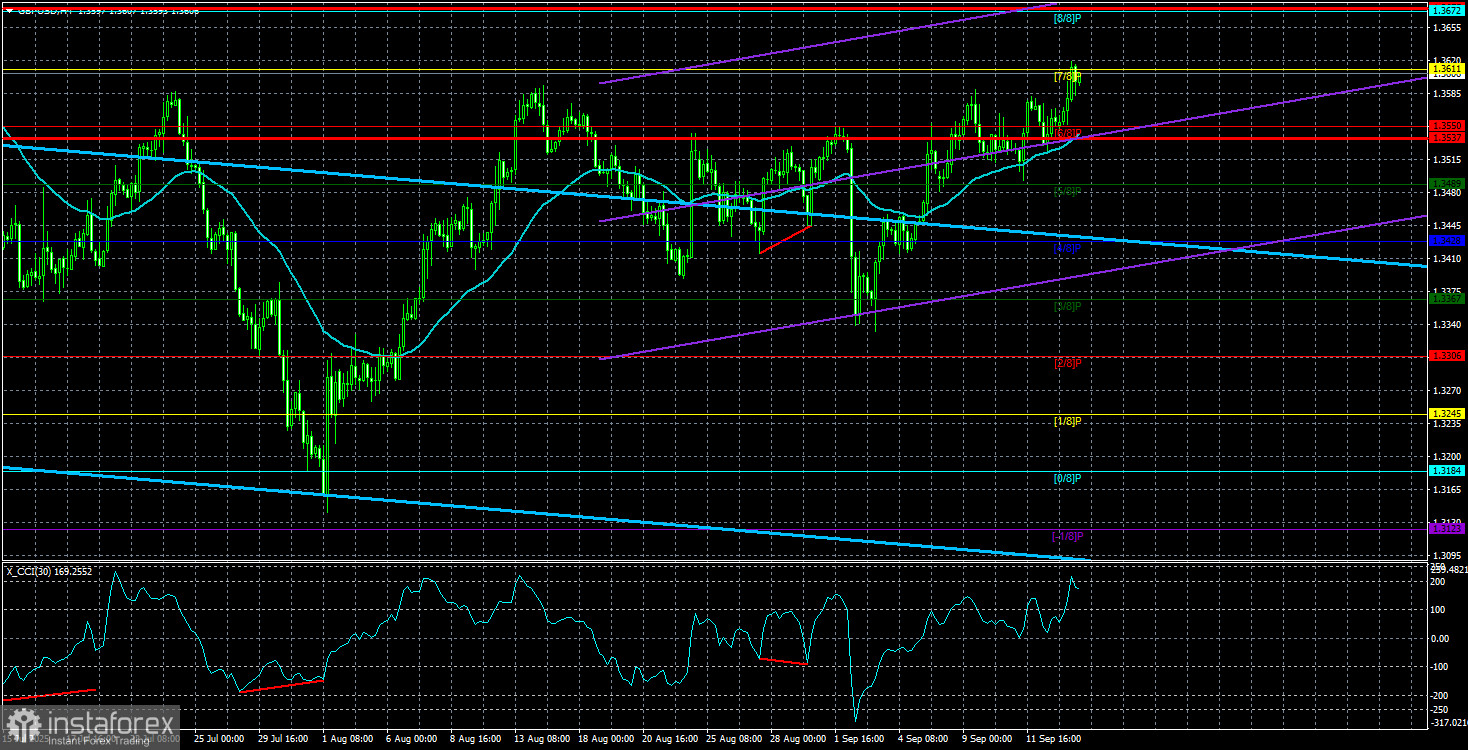
The GBP/USD currency pair surged briskly on Monday. No significant events were scheduled in either the UK or the US that day, so a typical "quiet Monday" was expected. However, the market decided otherwise. On Wednesday evening, the Federal Reserve will announce the results of its meeting, followed by the Bank of England on Thursday afternoon. We have repeatedly noted that the dollar once again faces highly unfavorable conditions for another decline. Let's discuss this in more detail.
The first step is to open the daily timeframe. It is clear that the British currency rallied strongly in the first half of 2025, something not seen with the pound for several years, if not longer. After that, a correction began, lasting no more than a month. During this period, the price corrected moderately, testing the Senkou Span B line, as well as the 38.2% Fibonacci retracement level. Thus, two strong technical signals of a resumed uptrend were received.
The second important factor is that the price managed to extend a new upward move. All Ichimoku indicator lines were breached, confirming the resumption of the trend.
The third and most crucial factor is the fundamental background. If the US dollar was already falling sharply when Fed rates were steady and the BoE was cutting, what can be expected if the Fed cuts rates while the BoE holds steady? Added to this is complete uncertainty regarding the future of Fed monetary policy, as it now largely depends on Donald Trump, who wants to see rates 3% below their current level.
Although Trump has not yet managed to force the Fed into an "ultra-dovish" stance, it remains unclear when and whether he will succeed in reshaping half of the FOMC as he seems to intend. If he does, rates could fall toward 1%. If not, this could serve as a "lifeline" for the dollar, which in that case would at least decline moderately rather than plummet like a 24-pound cannonball dropped from a tall building.
As for the BoE, its decisions in the near term will naturally be tied to inflation. UK inflation has already surged to 3.8% annually, twice the level of a year ago. If inflation has been rising steadily for a year, this is not simply a "spike caused by Trump's tariffs." The UK was the first to sign a trade deal with the US president, so tariffs should have affected it only slightly. Nevertheless, inflation began accelerating well before Trump took office, making it a clear trend.
If inflation has been climbing for a whole year, it could continue, something we may learn on Wednesday. Should inflation rise again, the next round of monetary easing will not occur anytime soon. For the pound, this presents an excellent opportunity to strengthen further while the conditions are favorable.
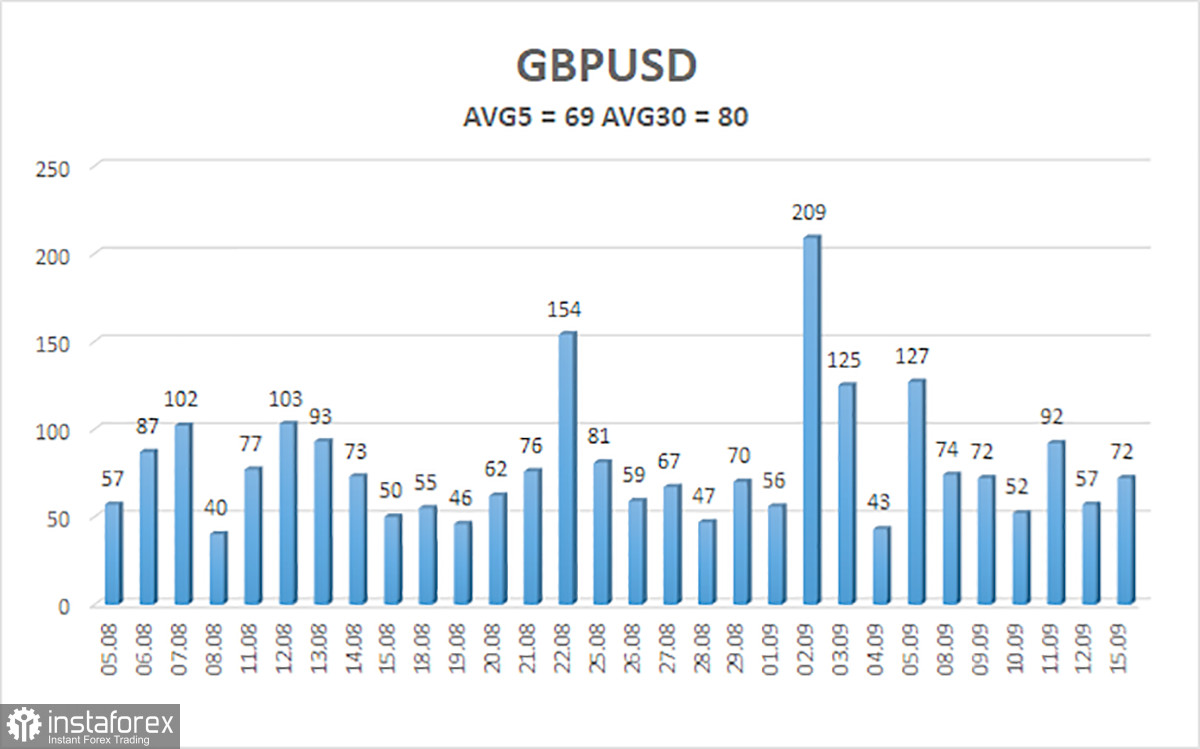
The average volatility of GBP/USD over the past five trading days stands at 69 pips, considered "average" for the pair. On Tuesday, September 16, we therefore expect movement within a range bounded by 1.3537 and 1.3675. The linear regression channel's upper band is pointing upward, indicating a clear bullish trend. The CCI indicator once again dipped into oversold territory, warning of trend resumption.
S1 – 1.3550
S2 – 1.3489
S3 – 1.3428
R1 – 1.3611
R2 – 1.3672
R3 – 1.3733
The GBP/USD pair is once again aiming to continue its uptrend. In the medium term, Trump's policies will likely keep pressuring the dollar, so no dollar strength is expected. Thus, long positions with targets at 1.3611 and 1.3672 remain highly relevant while the price is above the moving average. If the price falls below the moving average, small short positions may be considered on purely technical grounds. The US currency occasionally shows corrections, but sustainable trend growth would require clear signs of an end to the global trade war or other major positive drivers.


