আরও দেখুন

 22.09.2025 11:14 AM
Trend Analysis (Fig. 1)
On Monday, from the 1.3462 level (Friday's daily candle close), the market may begin moving upward toward the target of 1.3528 – the 50% retracement level (red dashed line). Upon testing this level, the price may then start moving down toward the 85.4% retracement level at 1.3516 (red dashed line).
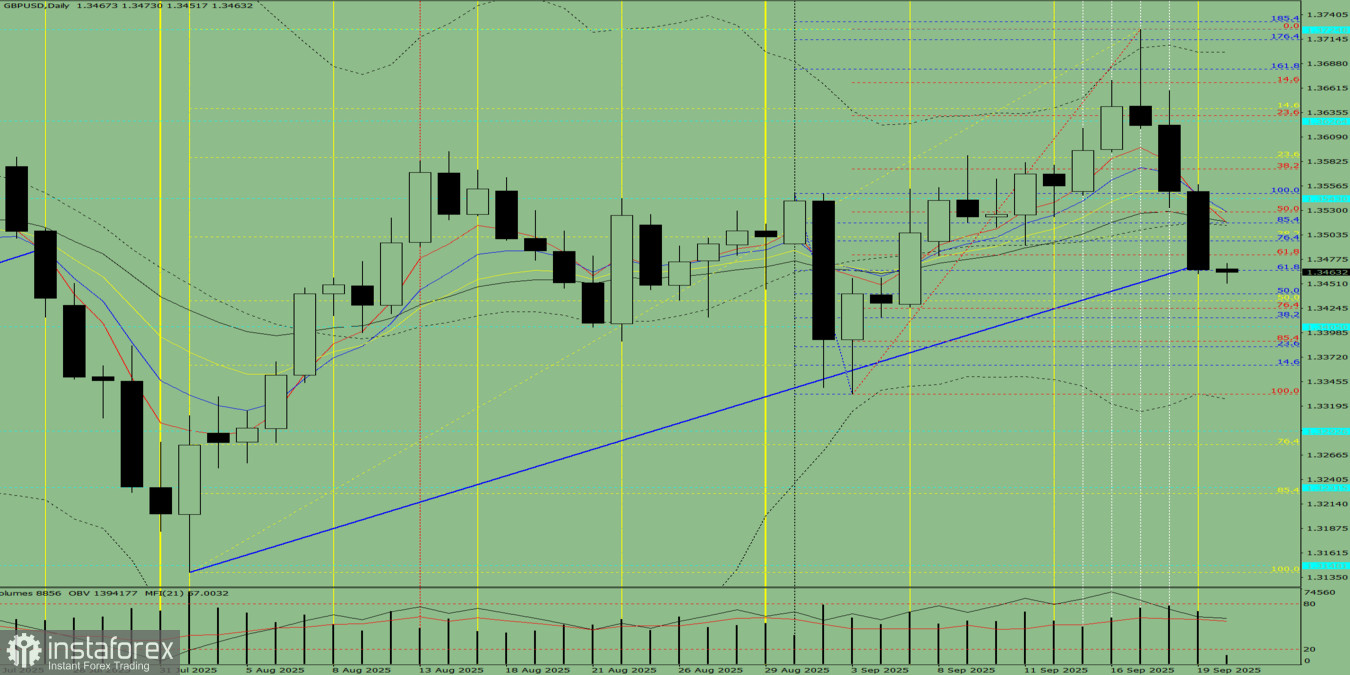
Fig. 1 (daily chart)
Comprehensive Analysis:
Overall conclusion: Upward trend.
Alternative scenario: From the 1.3462 level (Friday's daily candle close), the price may begin moving upward toward the target of 1.3548 – the upper fractal (blue dashed line). Upon testing this level, the price may then begin a downward movement toward the 50% retracement level at 1.3528 (red dashed line).
You have already liked this post today
*এখানে পোস্ট করা মার্কেট বিশ্লেষণ আপনার সচেতনতা বৃদ্ধির জন্য প্রদান করা হয়, ট্রেড করার নির্দেশনা প্রদানের জন্য প্রদান করা হয় না।


