আরও দেখুন

 26.09.2025 04:57 AM
USD/JPY
On the weekly chart, the price has moved above the Balance and MACD indicator lines. The Marlin oscillator is speeding up its upward movement. The target along the embedded price channel line at 151.45 is open. A firm hold above this level will open the way to the 157.70 target.
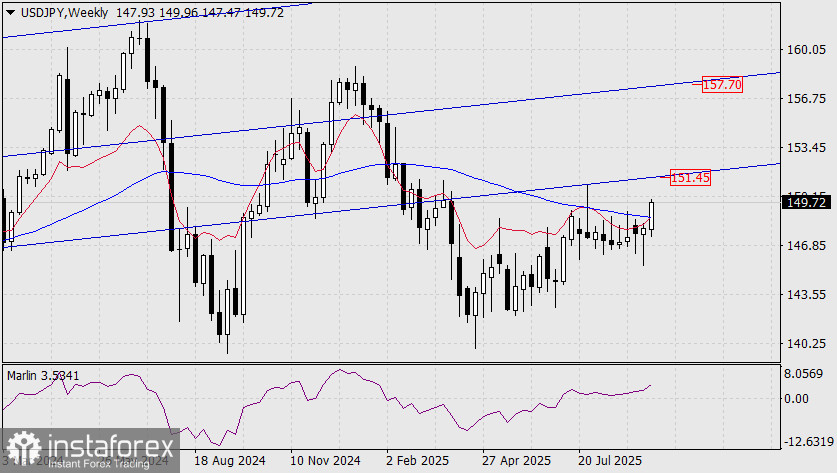
Despite the almost unequivocal outlook for this scenario, there is one powerful reason it might not materialize—a financial crisis in the US, accompanied by a deep drop in stock indices—something akin to what happened from February to April, when the S&P 500 plummeted by 21%. True, USD/JPY declined unevenly and unsynchronized during that period, but the crisis was not as systemic as it might become now.
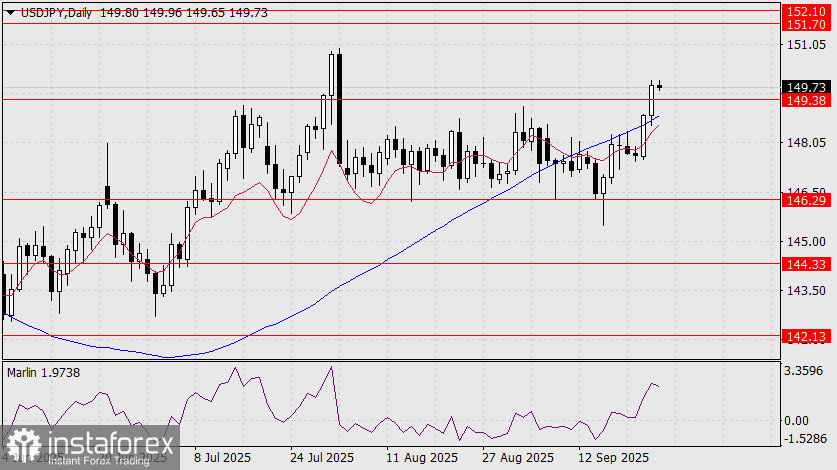
On the daily chart, the price, in sync with the weekly scenario, has risen above the MACD line. The resistance at 149.38 has also been surpassed. The Marlin oscillator is still far from the overbought zone, and the target range of 151.70–152.10 (highs from October 2022 and November 2023), which is just above the weekly target, is open.
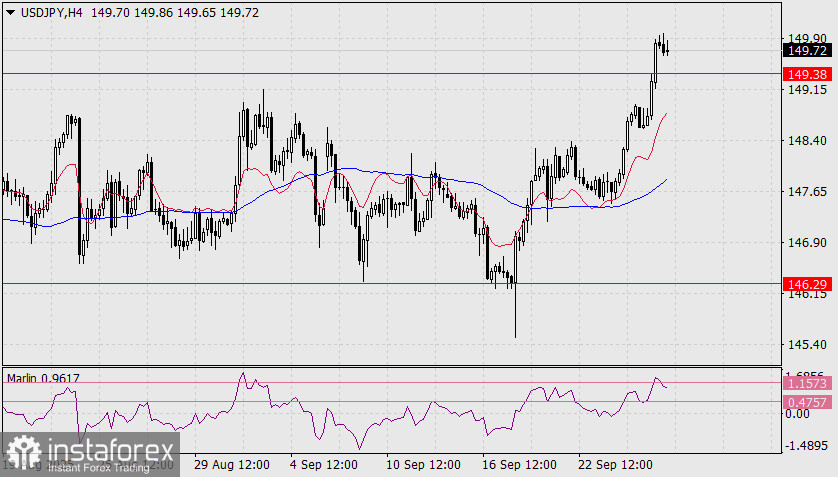
On the H4 chart, the price is holding above 149.38. The Marlin oscillator failed to consolidate above its own range of 0.4757–1.1573, indicating a sideways movement is likely, with support at 149.38. A resumption of upward movement could start on Monday. In any case, for the growth to continue, the price needs to break above yesterday's high.
You have already liked this post today
*এখানে পোস্ট করা মার্কেট বিশ্লেষণ আপনার সচেতনতা বৃদ্ধির জন্য প্রদান করা হয়, ট্রেড করার নির্দেশনা প্রদানের জন্য প্রদান করা হয় না।


