আরও দেখুন

 29.09.2025 10:17 AM
Trend analysis (Fig. 1).
On Monday, the market from the level of 1.1699 (Friday's daily candle close) may continue upward with the target at 1.1734 – the 8-period EMA (thin blue line). When testing this line, a move downward is possible with the target at 1.1685 – the 14.6% pullback level (red dotted line). Upon reaching this level, a further move upward is possible with the target at 1.1689 – the historical resistance level (blue dotted line).
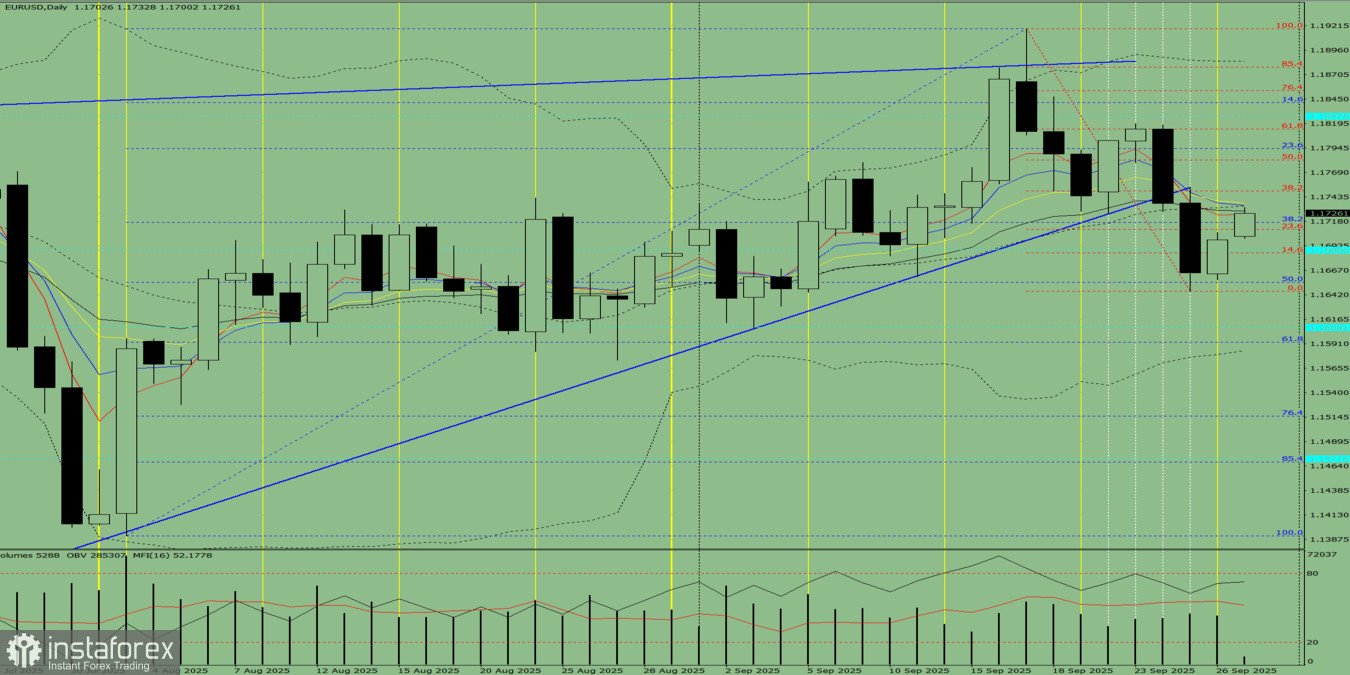
Fig. 1 (daily chart).
Comprehensive analysis:
General conclusion: downward trend.
Alternative scenario: from the level of 1.1699 (Friday's daily candle close), the price may start a move downward with the target at 1.1655 – the 50% pullback level (blue dotted line). Upon reaching this level, an upward move is possible with the target at 1.1685 – the 14.6% pullback level (red dotted line).
You have already liked this post today
*এখানে পোস্ট করা মার্কেট বিশ্লেষণ আপনার সচেতনতা বৃদ্ধির জন্য প্রদান করা হয়, ট্রেড করার নির্দেশনা প্রদানের জন্য প্রদান করা হয় না।


