আরও দেখুন

 10.11.2025 09:57 AM
GBP/USD
Brief Analysis:
On the British pound chart, a downward corrective wave has been forming since September 26. The structure of this wave is developing as an extended flat and is nearing completion. At the time of analysis, no reversal signals are observed. The price has bounced from the upper boundary of a strong potential reversal zone on the daily timeframe.
Weekly Forecast:
At the beginning of the upcoming week, the British pound is expected to complete its move toward the resistance zone. Then, a reversal and renewed price decline are likely. The projected zones show the most probable range of the pair's weekly movement.

Potential Reversal Zones
Recommendations:
AUD/USD
Brief Analysis:
On the Australian dollar chart, a downward wave pattern has been developing since mid-September. Within its structure, a counter-correction in the form of an extended flat has been forming over the past two weeks. This segment of the wave is now entering its final phase.
Weekly Forecast:
At the start of the week, the price is expected to continue moving sideways. A decline toward the support zone is highly likely. Afterwards, fluctuations may transition into a flat pattern. A reversal and renewed price growth are most probable toward the weekend.
Potential Reversal Zones
Recommendations:
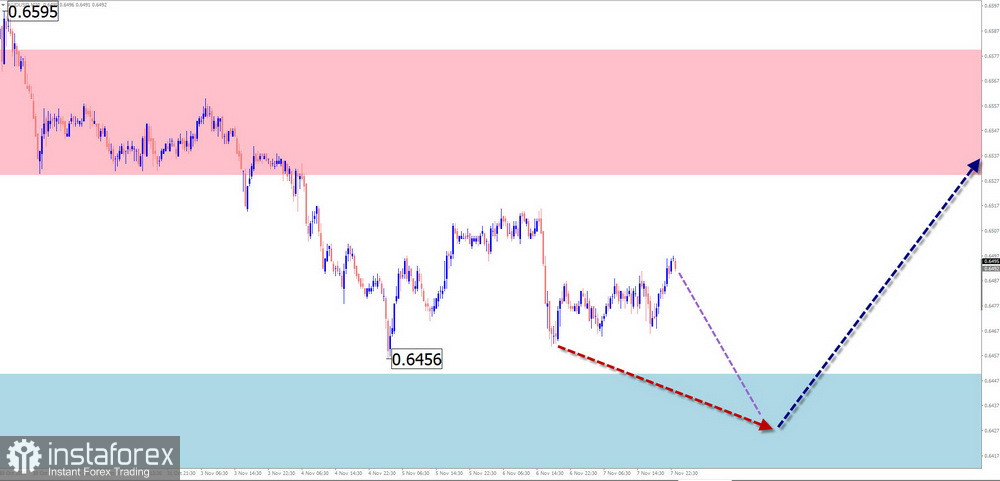
USD/CHF
Brief Analysis:
The ongoing bullish wave on the Swiss franc chart began in April of this year. The wave is developing as a shifting flat. At the time of analysis, the middle segment of the wave structure is in progress. Since mid-July, the price has been forming a corrective zigzag pattern from a strong support level.
Weekly Forecast:
A continuation of the downward movement is likely over the next few days. Then, volatility is expected to increase sharply. After contacting the support zone, a reversal and renewed price growth are expected. The projected resistance zone forms the upper boundary of the pair's expected weekly range.
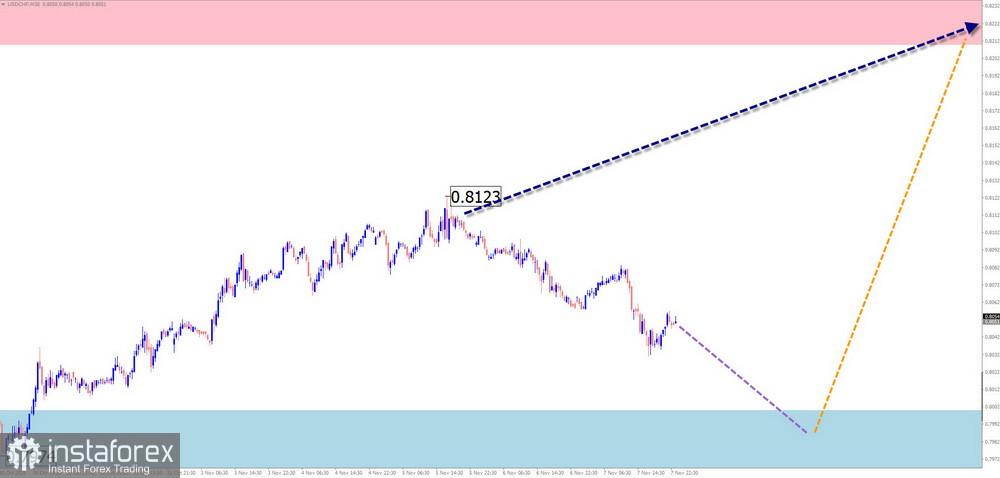
Potential Reversal Zones
Recommendations:
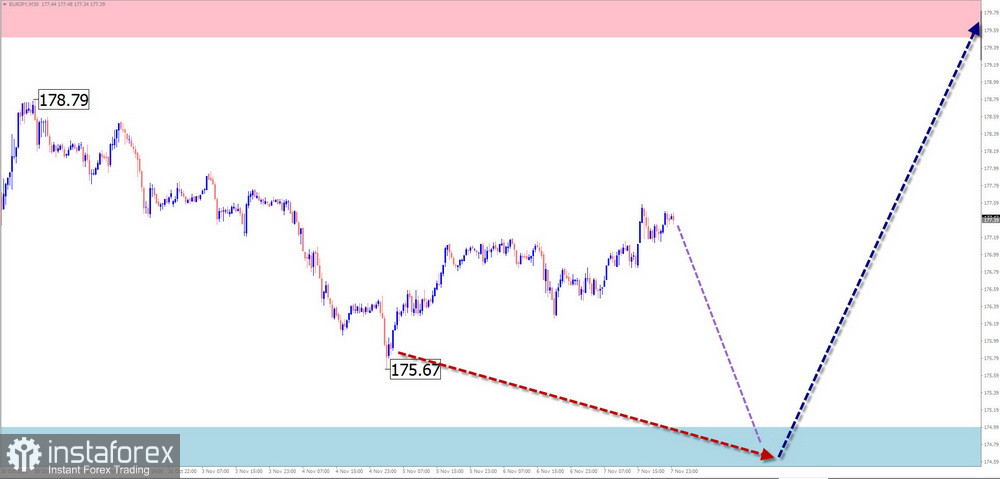
EUR/JPY
Brief Analysis:
The main direction of the euro–yen cross has been defined by an upward wave since March of this year. The unfinished segment began on October 1. A month ago, the price reached the boundaries of a strong resistance zone and is now approaching its upper edge. The structure's middle section (wave B) remains incomplete as of this analysis.
Weekly Forecast:
In the coming days, a downward price movement toward the support boundaries remains possible. Toward the weekend, increased volatility, a reversal, and a rise in price toward the resistance zone are likely.
Potential Reversal Zones
Recommendations:
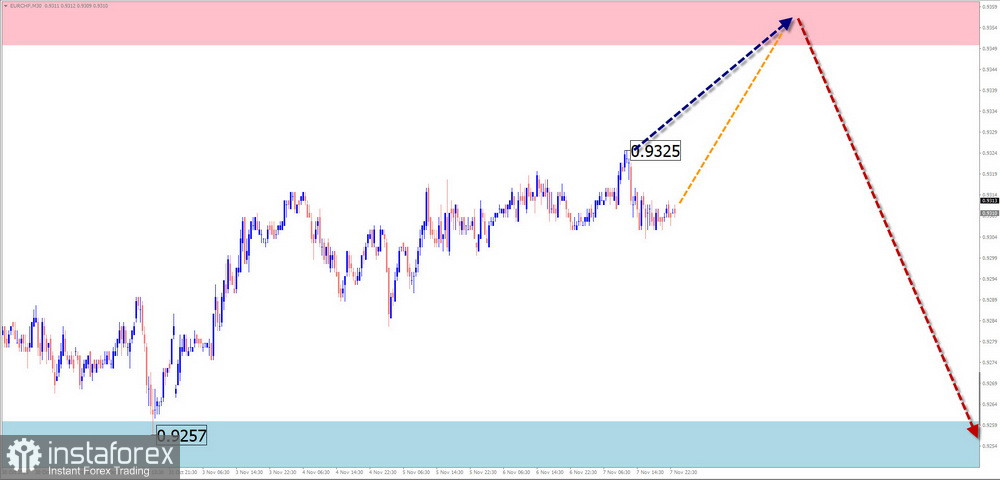
EUR/CHF
Brief Analysis:
On the euro–Swiss franc chart, a downward wave has been forming since March. The current counter-directional wave structure began in mid-August and is forming as an extended flat. The final segment of this structure remains incomplete.
Weekly Forecast:
In the next few days, sideways movement and a short-term rebound toward resistance are likely. Afterwards, the pair will likely move into a sideways range, forming a reversal. By the end of the week, a renewed price decline toward the support boundaries is expected.
Potential Reversal Zones
Recommendations:
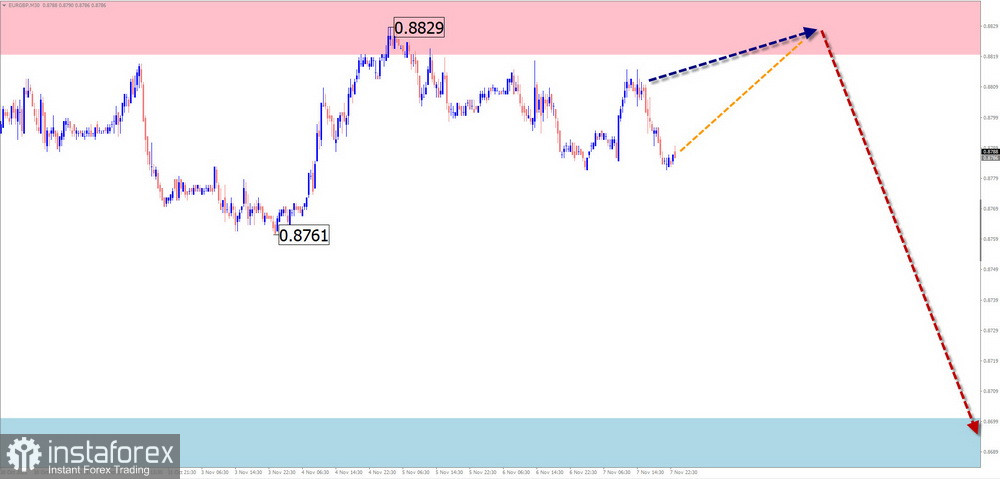
EUR/GBP
Brief Analysis:
Since April of this year, a downward shifting flat has been developing on the euro–pound chart. From the end of May, after bouncing from a strong support zone, the quotes formed an upward segment that marked the beginning of the corrective part (wave B). At the time of analysis, the price has reached the boundary of a strong potential reversal zone. No clear reversal signals are currently observed on the chart.
Weekly Forecast:
In the coming days, the pair is expected to continue moving sideways along the projected resistance zone. Afterwards, a reversal and the start of a downward price move are likely. The projected support marks the lower boundary of the expected decline.
Potential Reversal Zones
Recommendations:
Notes: In Simplified Wave Analysis (SWA), all waves consist of three parts (A–B–C). On each timeframe, the last incomplete wave is analyzed. Dashed lines indicate expected movements.
Attention: The wave algorithm does not take into account the duration of price movements over time!


