আরও দেখুন

 10.11.2025 10:16 AM
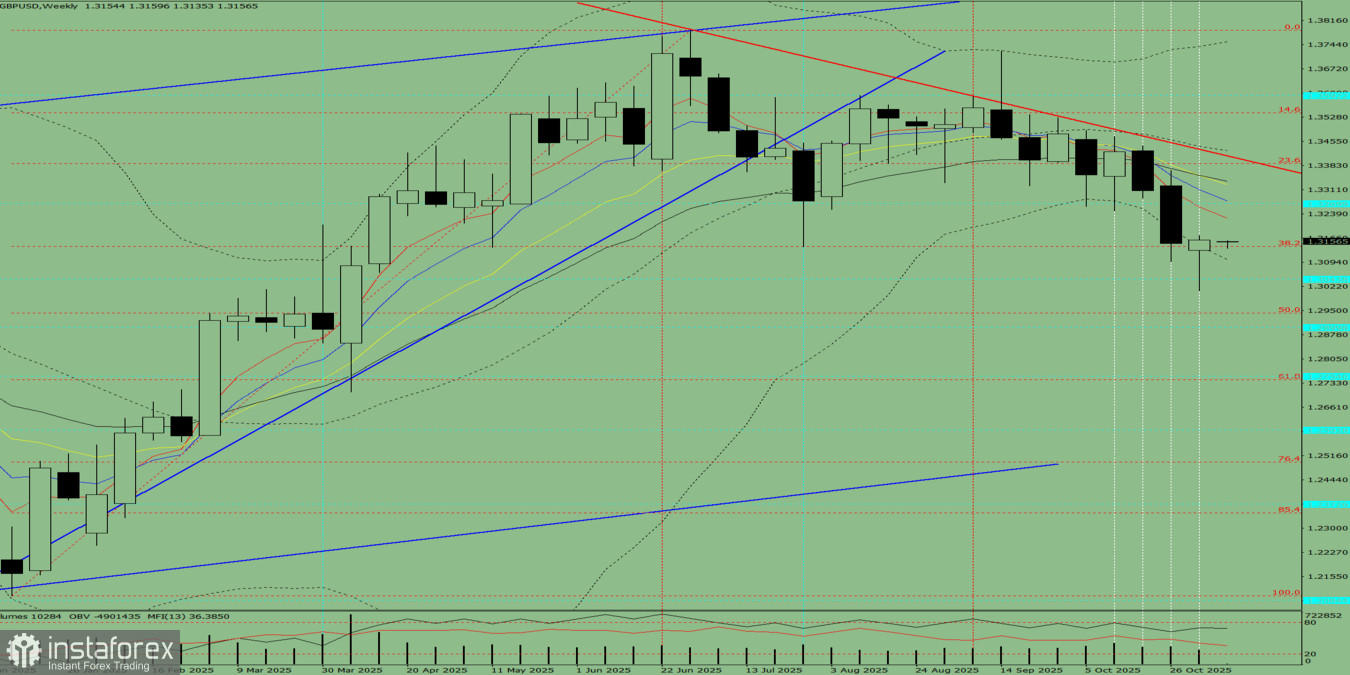
Fig. 1 (Weekly Chart)
Comprehensive Analysis:
Overall conclusion from the weekly GBP/USD analysis:During the week, the price will most likely exhibit a downward trend, with no upper shadow on the weekly black candle (Monday — downward movement) and the presence of a lower shadow (Friday — upward movement).
Alternative Scenario:
From the level of 1.3160 (the closing price of the last weekly candle), the price may continue moving downward toward 1.2900, a historical support level (light blue dotted line). Upon reaching this level, the price may begin moving upward toward 1.2943, the 50% retracement level (red dotted line).
You have already liked this post today
*এখানে পোস্ট করা মার্কেট বিশ্লেষণ আপনার সচেতনতা বৃদ্ধির জন্য প্রদান করা হয়, ট্রেড করার নির্দেশনা প্রদানের জন্য প্রদান করা হয় না।


