
আরও দেখুন


 17.07.2026 04:15 AM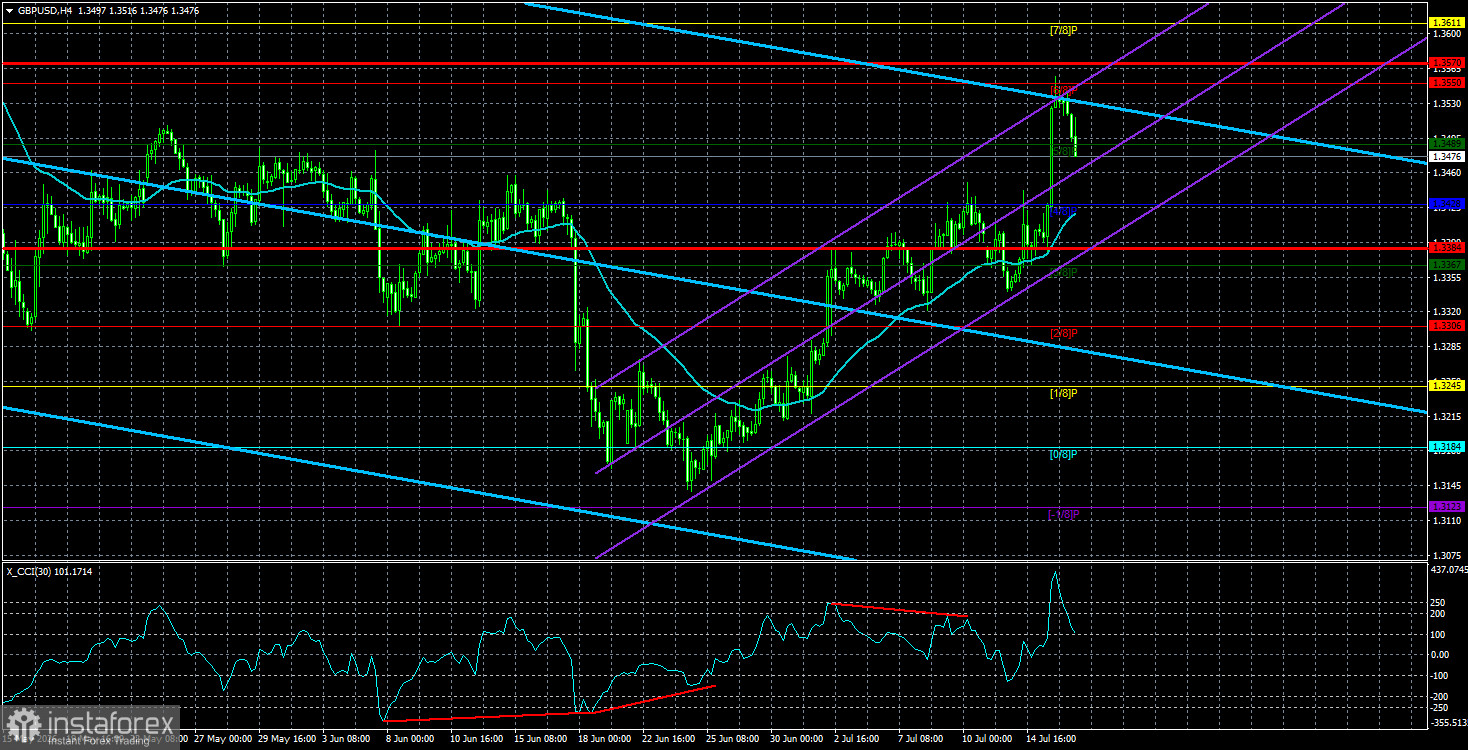
The GBP/USD currency pair retraced slightly from the day-before highs but remains generally positioned for further growth. Over the past few weeks, the British currency has risen by 400 pips and is trading quite reasonably. Recall that three weeks ago, the GBP/USD pair dropped to the lower boundary of its sideways channel on the daily and weekly timeframes, so, with the continued flat movement, a rise to the upper boundary was expected. It is worth noting that the long-term technical picture for the euro is approximately the same, so the euro should have shown a similar movement. However, something inexplicable is happening with the euro, which many experts do not even attempt to explain afterward. We would like to remind you that illogical movements in the market frequently occur. When this happens, it is best to acknowledge that the movement is illogical rather than concoct various fantastic explanations.
The pound sterling has risen because the last phase of its decline was completely unjustified. The dollar rose on the market's expectations of a tightening of the Federal Reserve's monetary policy, and in July, it became known that inflation is slowing in the U.S. without the central bank's assistance. How the conflict in the Middle East will develop remains unclear. Donald Trump is already calling for Iran to return to the negotiating table, as this is primarily in his interest. Therefore, we do not rule out that this time the escalation will end with reconciliation, a ceasefire, and the opening of the Strait of Hormuz for a couple more days. Regardless, the fact that oil prices are rising today does not mean they will be high in a couple of weeks. U.S. inflation for July could be nearly anything. If the Strait of Hormuz opens, it will slow down; if the Strait of Hormuz remains blocked and the Houthis also block the Bab el-Mandeb Strait, prices could rise even higher than 4.2%.
Incidentally, Iran, according to unverified information, has instructed the Houthis to close the Red Sea and the Bab el-Mandeb Strait if Trump resumes attacks in the region. In simple terms, if Trump continues to pursue a path of coercive pressure on Tehran, he will get a closed Bab el-Mandeb Strait alongside a closed Hormuz. In principle, Trump doesn't care about "some straits somewhere in Asia or Africa." American oil does not flow through them, and the problem of drowning Europeans is the responsibility of the Europeans themselves. Of course, ahead of the congressional elections, Trump needs to end the war with Iran to lower fuel and oil prices in the U.S. And along with them, inflation. However, it should be understood that Trump is unlikely to make concessions to Iran. A U.S. refusal of the free status of the Strait of Hormuz and the nuclear deal would mean total defeat and would label the president as a failure to the world. The same European Union would finally understand that if you are pressured, you must respond in kind. Iran responds, and therefore it wins. If Trump cannot succeed with Iran, Greenland will be next.
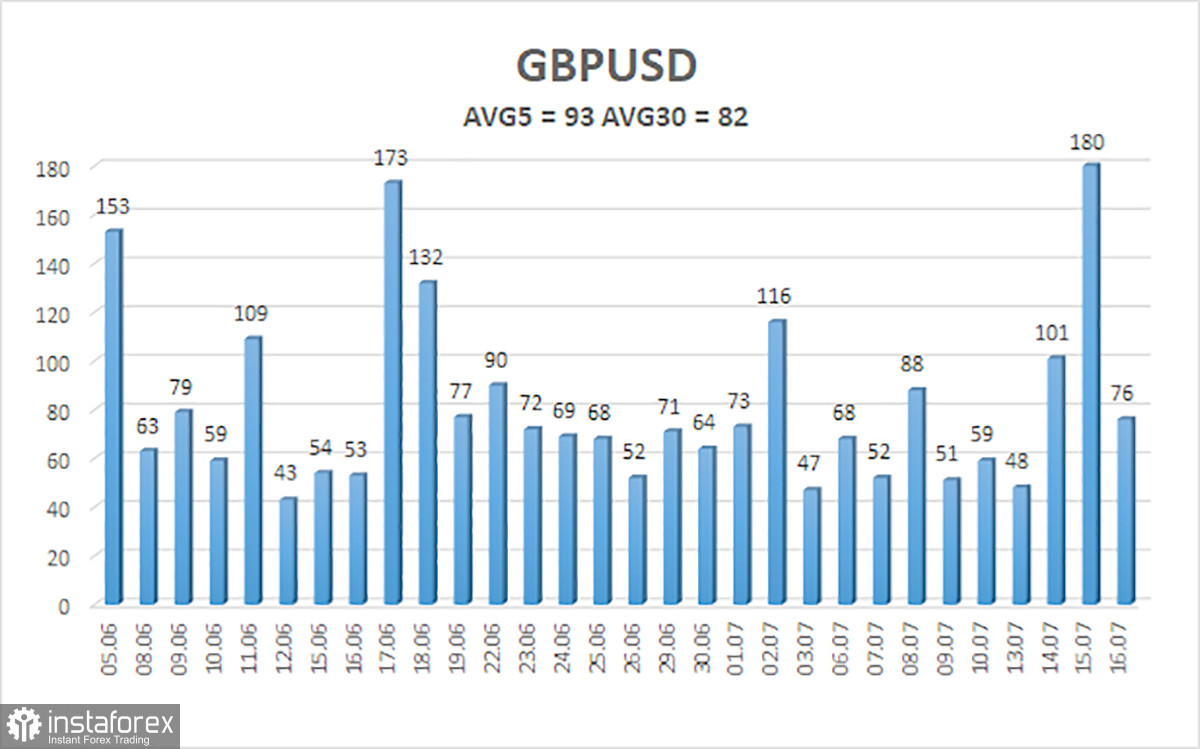
The average volatility of the GBP/USD pair over the last 5 trading days is 93 pips, which is considered "average" for this pair. On Friday, July 17, we expect the pair to move within a range bounded by the levels of 1.3384 and 1.3570. The upper linear regression channel is directed downward, indicating a downtrend. The CCI indicator has formed a "bearish" divergence and has entered the overbought area, signaling an impending downward correction.
S1 – 1.3428
S2 – 1.3367
S3 – 1.3306
R1 – 1.3489
R2 – 1.3550
R3 – 1.3611
The GBP/USD currency pair maintains a downward trend. Trump's policies will continue to exert pressure on the U.S. economy, so we do not expect growth from the U.S. dollar in the long term. The year 2026 is shaping up to be very positive for the dollar, driven by geopolitics and now by the Fed's readiness to raise interest rates. However, the weekly timeframe shows a flat range between levels 1.3150 and 1.3780 within a four-year uptrend. Long positions with targets at 1.3550 and 1.3570 can be considered when the price is above the moving average. If the price is below the moving average line, trading on the downside can be considered with a target of 1.3306.
Linear regression channels help determine the current trend. If both are directed in one direction, it means the trend is currently strong;
The moving average line (settings 20,0, smoothed) determines the short-term trend and the direction in which trading should currently be conducted;
Murray levels are target levels for movements and corrections;
Volatility levels (red lines) represent the likely price channel in which the pair will move over the next day based on current volatility indicators;
The CCI indicator's entry into the oversold zone (below -250) or overbought zone (above +250) indicates that a trend reversal in the opposite direction is approaching.


