
আরও দেখুন


 03.08.2026 04:56 AM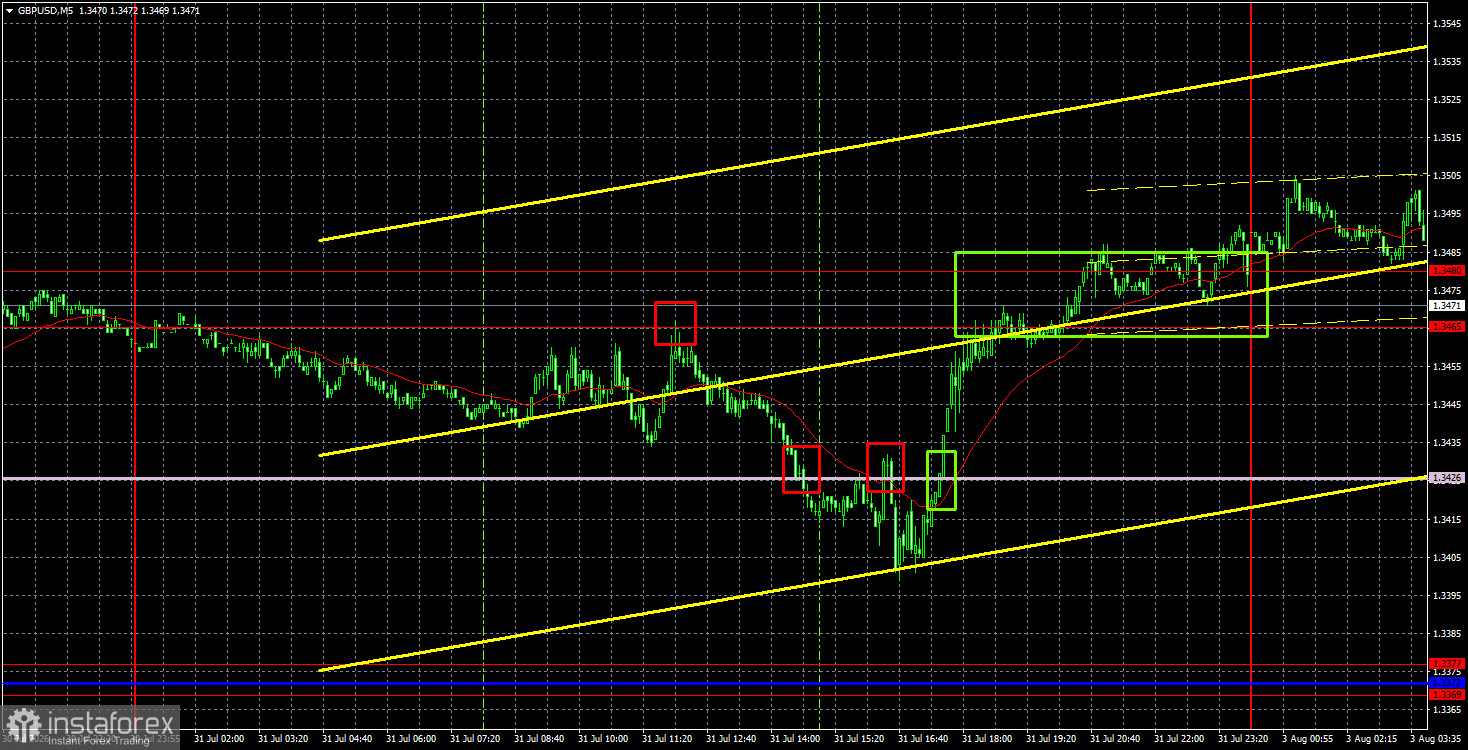
The GBP/USD currency pair exhibited quite strong growth on Friday. The entire past week was very successful for both the European and British currencies, which has scientific explanations. All key events and reports in the U.S. have failed. The market did not receive clear signals from the Federal Reserve indicating a readiness to begin tightening monetary policy. At the same time, the Bank of England has come much closer to raising the key interest rate than traders had anticipated. The conflict in the Middle East led to new oil price increases to $100. Inflation in the Eurozone has once again begun to accelerate.
Meanwhile, the U.S. economy has begun to show signs of slowing, which may limit the Fed's options for tightening monetary policy. In simple terms, last week showed that the market's overly optimistic sentiment toward the dollar does not reflect reality. It is also important not to forget the global technical picture. The British pound is within a sideways channel on the weekly timeframe and continues to move between its lower and upper boundaries. Thus, even without local fundamental and macroeconomic support, the British currency can still move another 200-300 pips higher.
From a technical perspective, the British pound has broken through the downward trend line and begun forming an upward trend. It is worth noting that, in the long term, the pound remains flat, as is evident on the weekly timeframe. After reaching the lower boundary of the sideways channel, a logical move towards the upper boundary began, though it is not yet complete.
On the 5-minute timeframe, several interesting signals were formed on Friday. During the European trading session, the price bounced off the 1.3465-1.3480 area and later exceeded the Senkou Span B line. The price could not continue to fall during the American session, so it consolidated back above the Senkou Span B line, allowing long positions to be opened. By the end of the day, the pair reached and exceeded the 1.3465-1.3480 area. Thus, two trades could have been opened, both of which proved to be profitable.
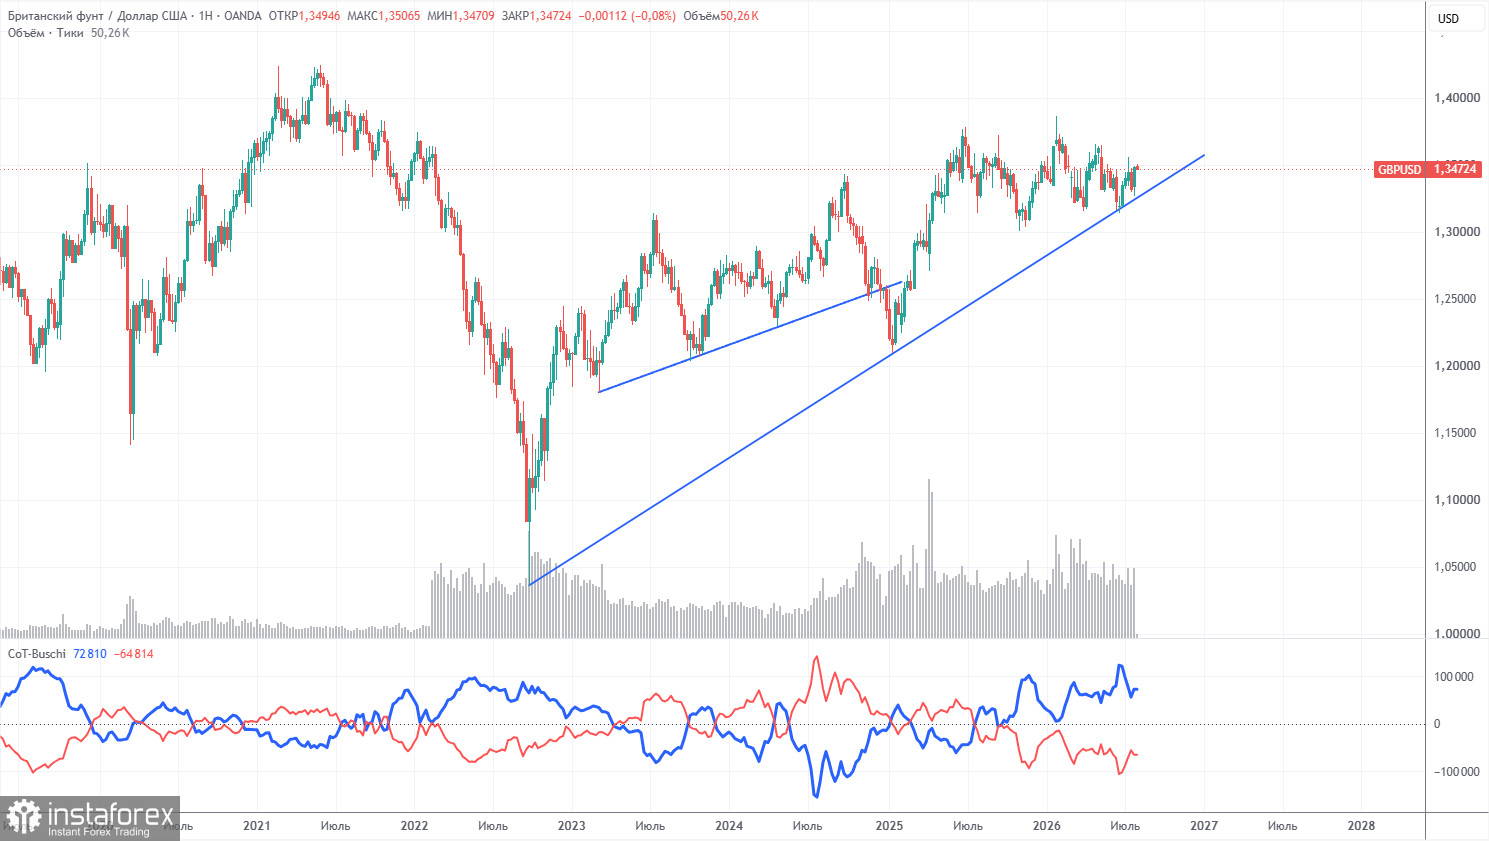
COT reports for the British pound show that non-commercial traders have dominated the market with sales for several months now. The net position is negative despite the ongoing upward trend in the long term. Given the events in the Middle East, it is not surprising that demand for risk currencies remains weak. The war is formally over, but the conflict continues. Geopolitics could support demand for the U.S. dollar in the near future. However, until there is a consolidation below the trend line, we would not expect a strong decline in the pair.
In the long term, the dollar will continue to decline due to Donald Trump's policies, as clearly seen on the weekly timeframe (illustration above). The trade war will continue in one form or another for a long time, and Trump's policies are aimed both directly and indirectly at weakening the American currency. The long-term upward trend remains, as evidenced by the trend line. The price recently reached this line and bounced off it. According to the latest COT report (dated July 28), the "Non-commercial" group closed 2,800 BUY contracts and opened 6,400 SELL contracts. Thus, the net position of non-commercial traders decreased by another 9,200 contracts over the week.
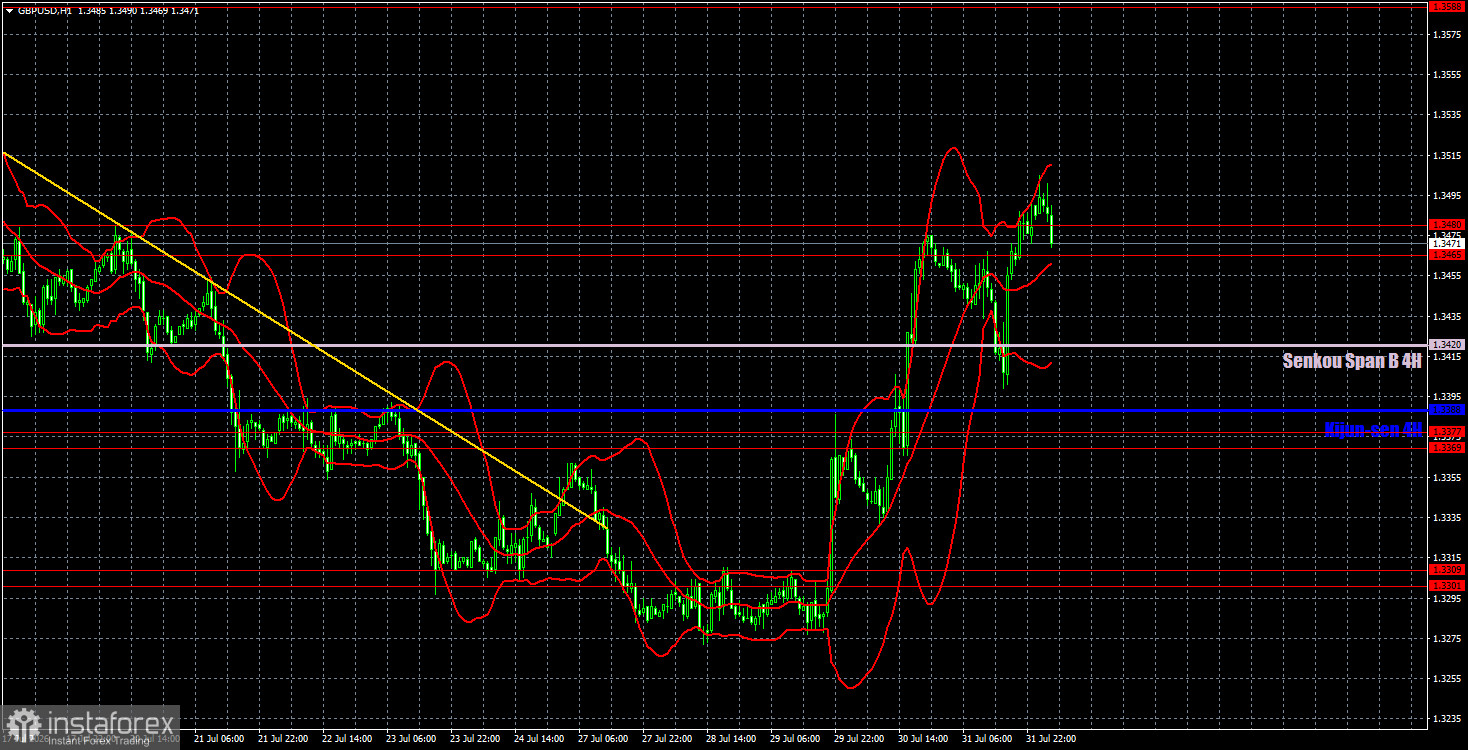
On the hourly timeframe, the GBP/USD pair has begun forming an upward trend, thanks to the Bank of England and the Fed. In the long term, both European currencies still look set to move higher and have been trading within sideways channels for a year now. This does not negate the upward trend that started back in 2022. We expect the British pound to continue to strengthen in the coming weeks, regardless of geopolitical and economic developments.
For August 3, we highlight the following important levels: 1.3042-1.3050, 1.3096-1.3115, 1.3179-1.3187, 1.3301-1.3309, 1.3369-1.3377, 1.3465-1.3480, 1.3588, 1.3671-1.3681. The Senkou Span B line (1.3420) and the Kijun-sen line (1.3388) can also serve as signal sources. It is advisable to set the Stop Loss level to breakeven once the price moves in the correct direction by 20 pips. The Ichimoku indicator lines may move during the day, which should be taken into account when determining trading signals.
On Monday, only the second estimate of the UK manufacturing PMI index will be released, which is unlikely to interest traders. In the U.S., the ISM manufacturing index, which is expected to attract market interest, will be released today.
Today, traders may open short positions targeting 1.3420 and 1.3388 if the price consolidates below the 1.3465-1.3480 area. Long positions can be opened on a bounce from the 1.3465-1.3480 area, targeting 1.3588.
Support and resistance price levels are thick red lines around which movement might end. They are not sources of trading signals.
The Kijun-sen and Senkou Span B lines are Ichimoku indicator lines transferred to the hourly timeframe from the 4-hour one. They are strong lines.
Extreme levels are thin red lines from which the price has previously bounced. They are sources of trading signals.
Yellow lines represent trend lines, trend channels, and any other technical patterns.
Indicator 1 on the COT charts indicates the size of the net position of each category of traders.


