
আরও দেখুন


 23.10.2026 05:34 AM
The EUR/USD currency pair again showed absolutely no interesting moves on Thursday, and volatility remained low. During the day, the euro fell slightly, but the decline occurred within the sideways channel that formed over the past week. We can even identify the boundaries of this local channel — 1.1190 and 1.1260. Thus, on Friday morning, price sits near the lower boundary of this channel and near the Ichimoku Kijun-sen and Senkou Span B lines. Accordingly, a bounce off these three support levels could trigger a new upswing in the pair, at least within the sideways channel. This means traders can expect a move toward 1.1260–1.1274 today. If the price breaks through the Ichimoku lines, the downtrend that began about six weeks ago will likely resume; within that trend, the U.S. currency gained more than 500 pips with almost no pullbacks or corrections. Over the past week and a half, the market has shown only one thing — a complete unwillingness to buy the euro under any circumstances. Even the pound is rising now, but the euro is not.
Technically, the downtrend may be finished because the trend line has been broken. For five consecutive weeks, the market bought the dollar on any excuse, but now it cannot overcome even the nearest resistance at 1.1274. We still see no appetite in the market to buy the euro.
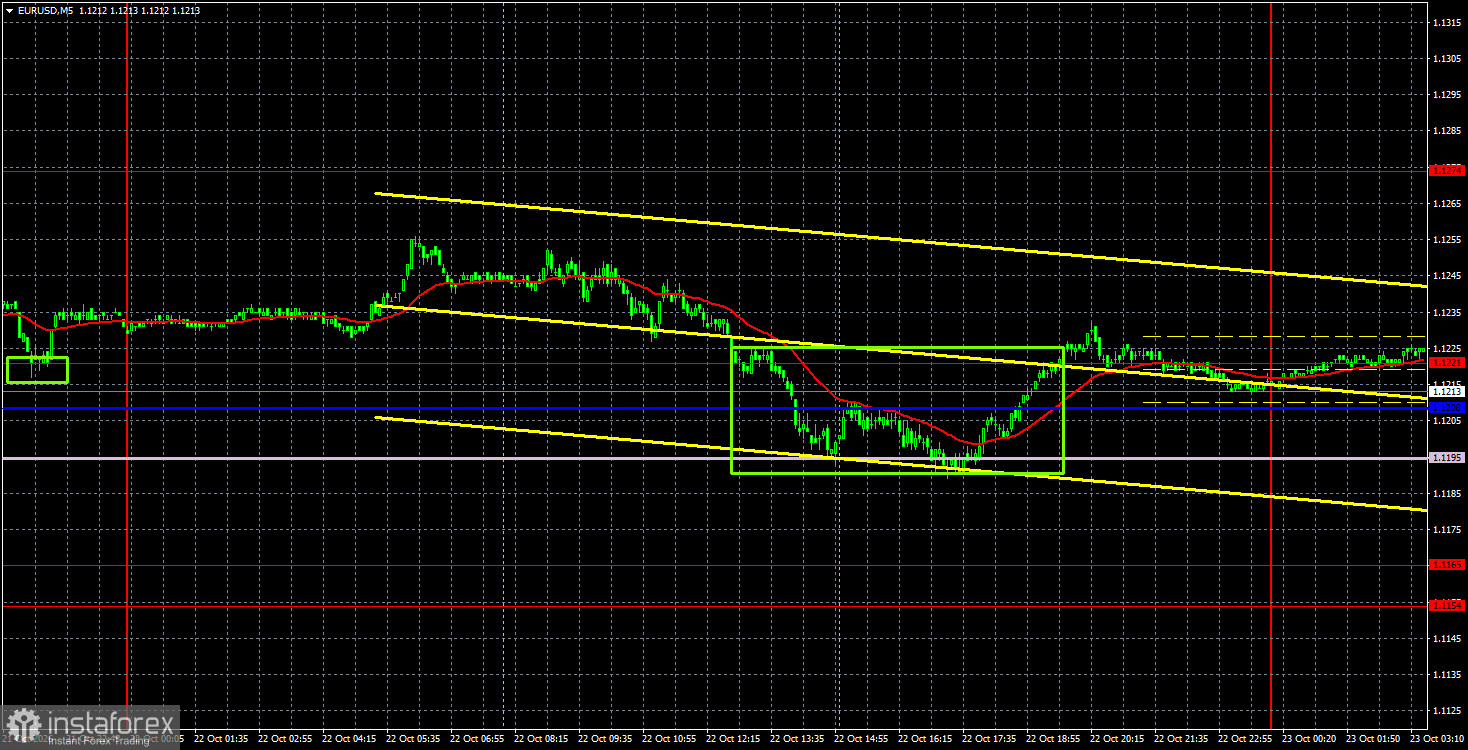
On the 5-minute TF, one promising buy signal formed on Thursday. The price essentially failed to penetrate the 1.1195–1.1221 area, so today an upward move to 1.1260–1.1274 may occur. Despite a fairly rich macroeconomic calendar at the end of the week, we still do not expect strong volatility.
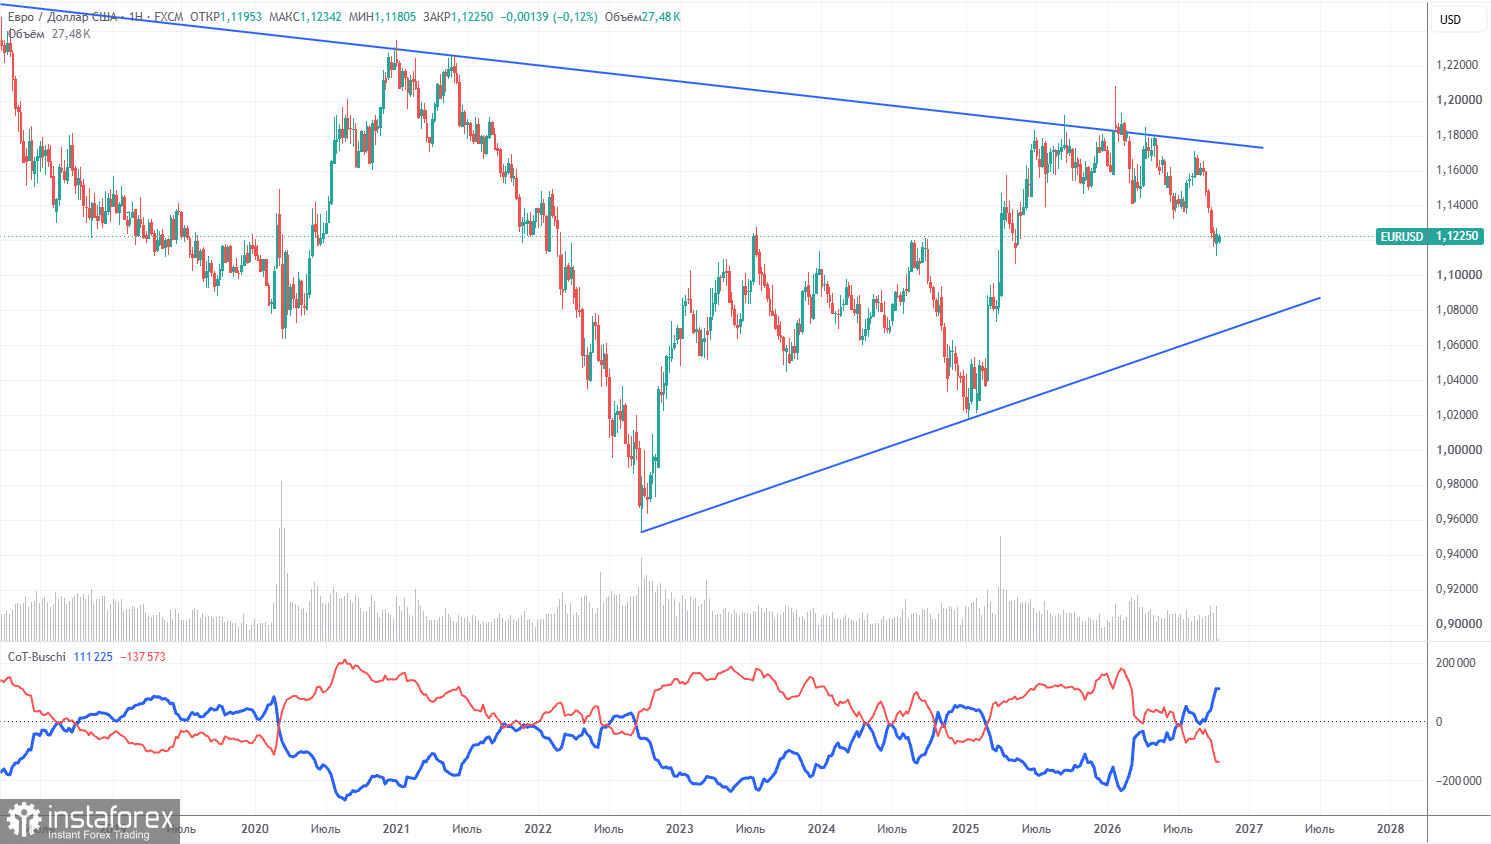
The latest COT report is dated October 13. The weekly chart shows that non-commercial traders' net position remains bearish and has declined substantially in 2026 due to geopolitical events. Over the past eight months, traders have reduced euro exposure in favor of the US dollar. Donald Trump's policies have not changed, but the dollar has served as a "reserve" currency for a time.
However, we still see no fundamental basis for further long-term strengthening of the US dollar. The war in the Middle East made the dollar temporarily very attractive, and the Federal Reserve's monetary stance surprised the dollar for the second time this year. In the long run, the euro could fall to $1.08 (the trendline), but the uptrend will remain relevant. Recently, the market has incorporated only dollar-positive factors and ignored everything else.
The positioning of the red and blue indicator lines points to the bears' advantage. Last reporting week, long positions in the "Non-commercial" group fell by 20,100, while shorts rose by 18,200. Accordingly, net non-commercial positions fell by another 38,300 contracts over the week.
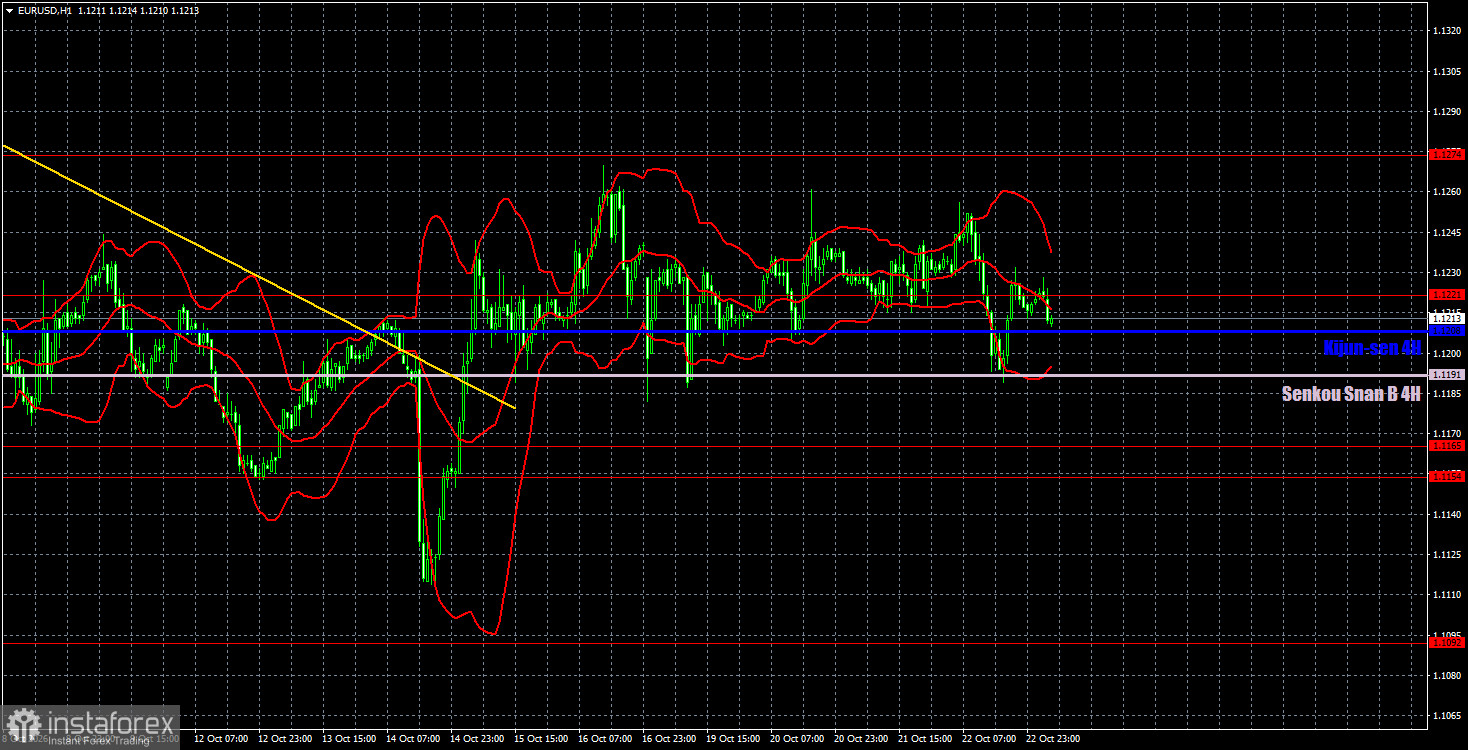
On the hourly timeframe, EUR/USD finally has the opportunity to form an uptrend. If you also look at the daily and weekly TFs, it becomes clear that the chances of a strong and lasting trend remain high. However, for the euro to rise, it must be bought. Over the past week and a half, we have not observed any willingness in the market to buy the euro. Therefore, based on market sentiment, we would say a new decline is more likely.
For October 23 we highlight the following levels for trading — 1.1092, 1.1154–1.1165, 1.1221, 1.1274, 1.1362–1.1368, 1.1461–1.1473, 1.1536–1.1542, 1.1585, 1.1657–1.1665, as well as the Senkou Span B line (1.1191) and the Kijun-sen (1.1208). Ichimoku lines may shift during the day, so account for this when determining trading signals. Remember to move your Stop Loss to breakeven if the price moves 15 pips in the right direction. This will protect against losses if the signal proves false.
On Friday, the EU, Germany and the US will publish purchasing-managers indices for services and manufacturing. European indices may provoke a market reaction; American ones likely will not. If European PMIs do not collapse today, we see no grounds for the price to overcome the Ichimoku lines area.
Traders can consider short positions near 1.1154–1.1165 and 1.1092 if price holds below 1.1191–1.1208. If price bounces from the 1.1191–1.1221 area, consider 1.1260–1.1274 as a target for long positions.


