empty
06.11.2023 06:29 AM
BITCOIN: Technical analysis of the situation

Bitcoin

This image is no longer relevant

Higher timeframes

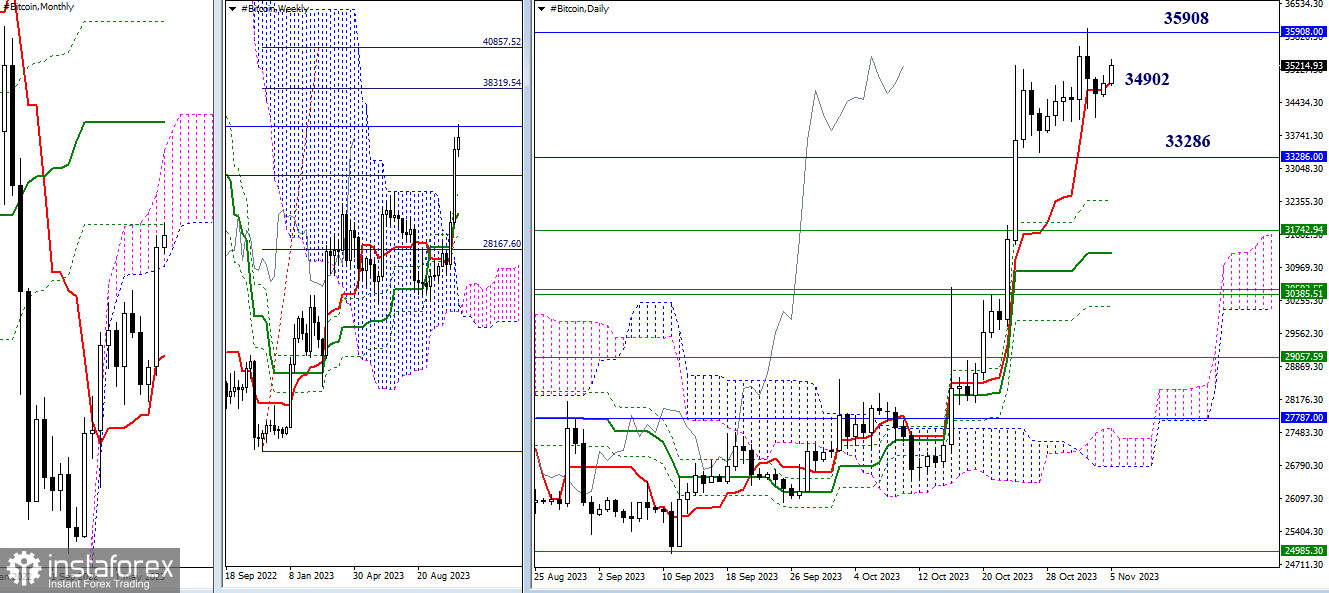
October provided bulls with moments of optimism, pushing the market away from the support of the monthly short-term trend towards the next resistance of the monthly death cross (35,908). Meanwhile, Bitcoin managed to close October within the monthly cloud (33,286), making the upper boundary of the Ichimoku cloud (40,490) the next upward target on this timeframe.

The result of October's activity was also the formation of an upward target for breaking the weekly cloud (38,320 - 40,858). These target levels (38,320 - 40,490 - 40,858) have been planned by the bullish players for November following the optimism and activity of October. This will only be possible if the bulls maintain and continue the October sentiment.

If priorities change and the bears return to the market. In that case, their focus will first be on exiting the monthly cloud (33,286) and then testing and liquidating the existing golden crosses of Ichimoku on the weekly and daily timeframes. The nearest supports from the golden crosses of Ichimoku at the moment can be noted at 32,380 - 31,743 - 31,261.

This image is no longer relevant

H4 - H1

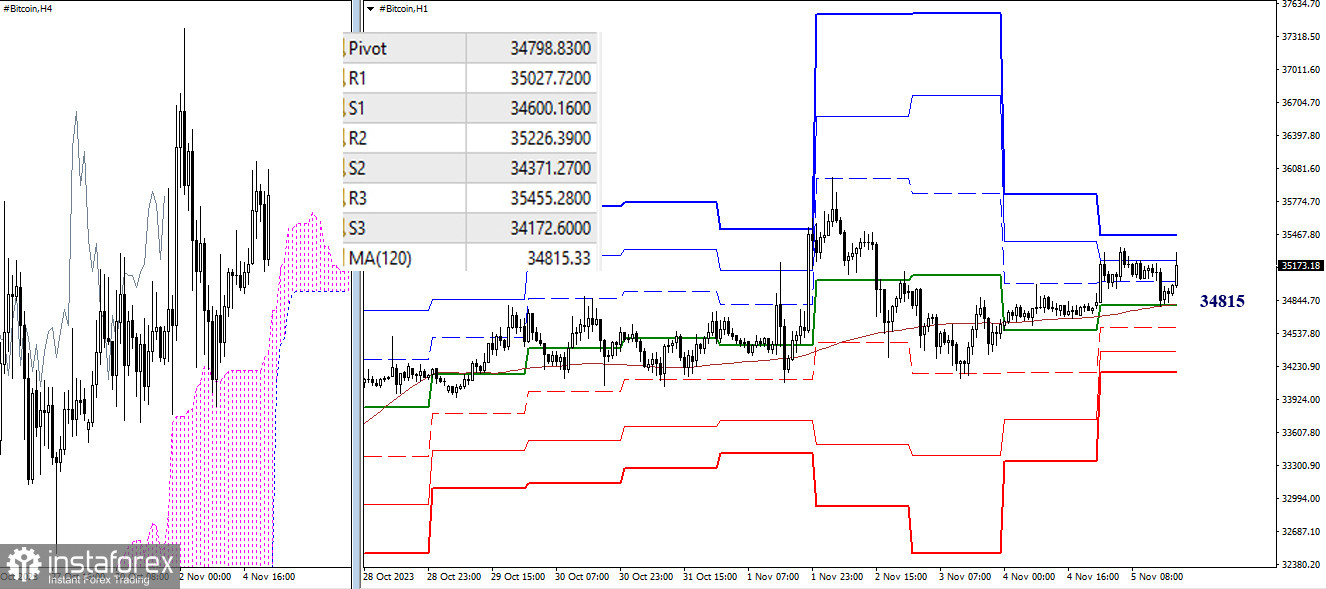
As of writing, the main advantage on the lower timeframes remains with the bullish players. However, the balance of power is very fragile because the weekly long-term trend (34,815) has been acting as support for a long time, responsible for the distribution and balance of power. Bitcoin can lose this support at any moment, after which the market's attention will shift within the day to the supports of the classic pivot points. The primary priority in this case will be the strengthening of bearish sentiments.

Note that the loss of the key level of the lower timeframes—34,815 (weekly long-term trend), is currently associated with losing the center of attraction of the daily timeframe—34,902 (short-term trend). A secure consolidation below 34,902 - 34,815 opens up new prospects for bears, both within the day and on the higher timeframes.

***

The technical analysis of the situation uses:

Higher timeframes - Ichimoku Kinko Hyo (9.26.52) + Fibo Kijun levels

H1 - Pivot Points (classic) + Moving Average 120 (weekly long-term trend)

Evangelos Poulakis,
Analytical expert of InstaTrade
© 2007-2025

Recommended Stories

歐元/美元。分析與預測

在新一週的開始,歐元/美元(EUR/USD)因美元走弱而獲得上升動能。 從技術層面來看,上週跌破4小時圖上的200期簡單移動平均線(SMA)被解讀為一個重要的看跌信號。

Irina Yanina 17:58 2025-05-19 UTC+2

2025年5月19日至21日EUR/USD交易信號:在1.1285以下賣出(200EMA - GAP)

在美國交易時段早期,EUR/USD 匯率約在 1.1266 交投,達到了下行趨勢通道的頂部,並顯示出疲憊跡象。 本週開盤時,歐元留下了一個缺口,預計在接下來幾天內會被補回。

Dimitrios Zappas 14:30 2025-05-19 UTC+2

2025年5月19-21日黃金交易信號:低於$3,247(200指數平滑移動平均線 - 缺口)賣出

在美國市場早盤時段,黃金交易價格約為3,245,達到上升趨勢通道的頂部,顯示出多頭力量的耗竭。 未來幾小時,我們預計XAU/USD可能會進行技術性回調,達到3,204的位置,即21日簡單移動平均線(SMA)所在的位置。

Dimitrios Zappas 14:29 2025-05-19 UTC+2

外匯預測 2025年5月19日:歐元/美元、英鎊/美元、美元/日圓、美元/加元、黃金、以太坊和比特幣

相關連結: 我的其他文章可以在此部分查看 InstaForex 初學者課程 熱門分析工具 開設交易賬戶 重要提示: 外匯交易的新手在做入市決策時需要非常謹慎。在重要報告發布之前,最好保持觀望,以避免因波動性增加而造成的激烈市場波動。

Sebastian Seliga 10:52 2025-05-19 UTC+2

歐元/美元。5月19日。歐元持續面臨壓力

週五,歐元/美元兌美元組合持續溫和下跌。記錄顯示收盤價跌破127.2%斐波那契水平1.1181,但空頭未能在此成功上有所建樹。

Samir Klishi 10:45 2025-05-19 UTC+2

2025年5月19日英鎊/美元匯率預測

在小時圖上,GBP/USD 在週五持續橫盤波動,震盪於1.3205至1.3344之間。隨著被1.3344–1.3357的阻力區拒絕,仍有進一步下降至1.3205的100.0%斐波那契水平的可能。

Samir Klishi 10:36 2025-05-19 UTC+2

2025年5月19日星期一,黃金商品工具日內價格波動的技術分析。

在4小時圖上,隨著隨機振盪指標出現買入信號,以及價格運行在WMA (21) 之上,加上出現看漲123型態,只要沒有穿透並收在3120.34以下的弱勢修正,黃金有可能走強,而3312.14將是主要的測試目標,甚至如果波動性和增長動能支持,3373.02將是下一個瞄準的目標。 (免責聲明)。

Arief Makmur 07:58 2025-05-19 UTC+2

EUR/JPY 交叉貨幣對日內價格走勢技術分析,2025年5月19日星期一。

儘管在4小時圖上賣盤仍然佔據主導地位,但EUR/JPY的價格走勢正在移動到低於WMA(21)的水平,並呈現下行趨勢。值得注意的是,EUR/JPY的價格走勢與隨機震盪指標之間出現了背離現象。

Arief Makmur 07:58 2025-05-19 UTC+2

2025年5月19日歐元/美元預測

週五,歐元未能保持向上的勢頭,但也沒有跌破日線MACD指標線——當日雖以陰線收盤,但仍位於1.1110/50區間的上邊界之上。 週一開盤微幅上漲,形成了一個小缺口——再次圍繞MACD線。

Laurie Bailey 07:00 2025-05-19 UTC+2

2025年5月19日英鎊/美元預測

週五,英鎊未能突破阻力位1.3311。即使在Marlin振蕩器上形成的“頭肩頂”形態也無法起到幫助作用——價格繼續在1.3311水準下方橫盤整理。

Laurie Bailey 07:00 2025-05-19 UTC+2
现在无法通话?
提出您的问题,用 在线帮助.
 

Dear visitor,

Your IP address shows that you are currently located in the USA. If you are a resident of the United States, you are prohibited from using the services of InstaFintech Group including online trading, online transfers, deposit/withdrawal of funds, etc.

If you think you are seeing this message by mistake and your location is not the US, kindly proceed to the website. Otherwise, you must leave the website in order to comply with government restrictions.

Why does your IP address show your location as the USA?

  • - you are using a VPN provided by a hosting company based in the United States;
  • - your IP does not have proper WHOIS records;
  • - an error occurred in the WHOIS geolocation database.

Please confirm whether you are a US resident or not by clicking the relevant button below. If you choose the wrong option, being a US resident, you will not be able to open an account with InstaTrade anyway.

We are sorry for any inconvenience caused by this message.