
 18.06.2025 11:45 AM
On the hourly chart, the GBP/USD pair continued its decline on Tuesday after bouncing off the 1.3611–1.3633 resistance zone and reached the support zone at 1.3425–1.3444. A rebound from this zone would suggest a reversal in favor of the pound and a potential rise toward the 127.2% Fibonacci corrective level at 1.3527. A firm move below this zone would favor the U.S. dollar and continue the decline toward the next support zone at 1.3357–1.3373.
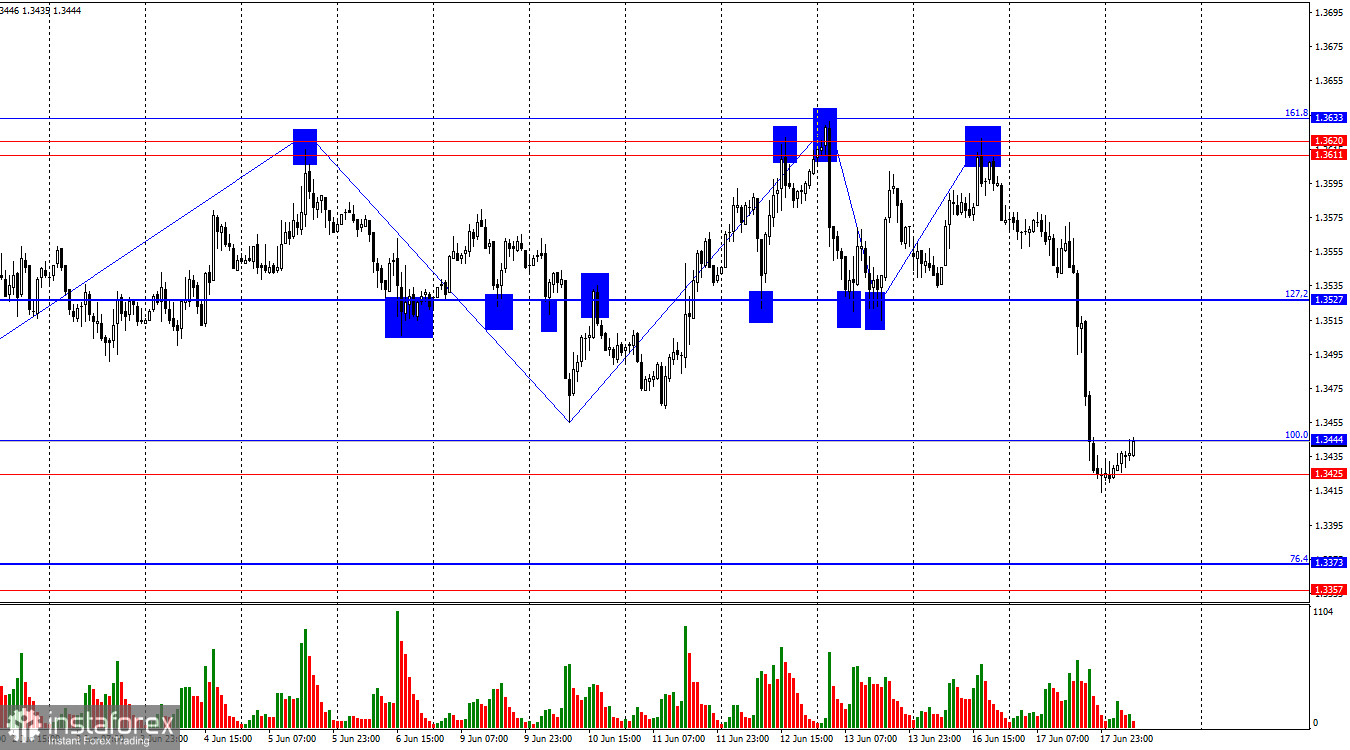
The wave pattern indicates a possible end of the bullish trend. The last upward wave did not break the previous peak, while the last downward wave broke below the previous low. Bulls continue to face difficulty sustaining further growth without fresh negative news from the U.S. president, so they have temporarily retreated. I believe this retreat may be short-lived.
There was little news for the pound on Tuesday, but we saw a strong bearish attack in the second half of the day. What caused it? It was reported that Donald Trump convened the National Security Council and is prepared to strike Iranian military and nuclear infrastructure. This marks a new escalation of the conflict between Israel and Iran, in which the U.S. may officially become involved. Additionally, today marks the conclusion of the FOMC's two-day meeting, and traders often try to anticipate its outcomes, Powell's tone, and reflect their expectations in market charts. Thus, there were no obvious reasons for the dollar's rise on Tuesday—but there were at least two subtle ones.
Separately, note the U.K. inflation report released this morning. While the headline CPI fell in line with forecasts to 3.4% y/y, core inflation slowed more than expected to 3.5%. In any case, inflation in the U.K. remains elevated, not declining. The Bank of England is likely to leave its monetary policy parameters unchanged on Thursday.
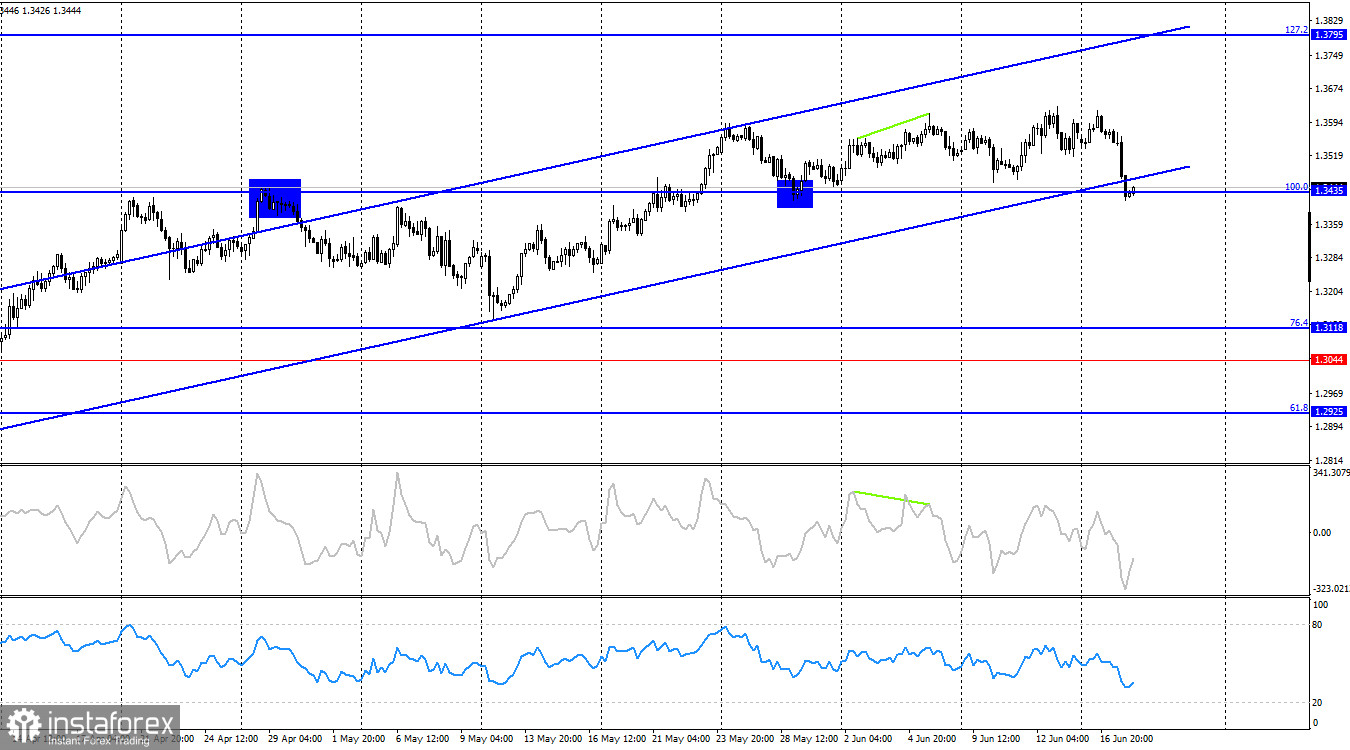
On the 4-hour chart, the pair has returned to the 100.0% Fibonacci level at 1.3435. A new rebound from this level would support the pound and renew the uptrend toward the next Fibonacci level at 1.3795. The bullish trend remains intact for now, but a close below 1.3435 could trigger a decline toward the 76.4% level at 1.3118. This would also mean a close below the bullish channel. No emerging divergences are currently observed across indicators.
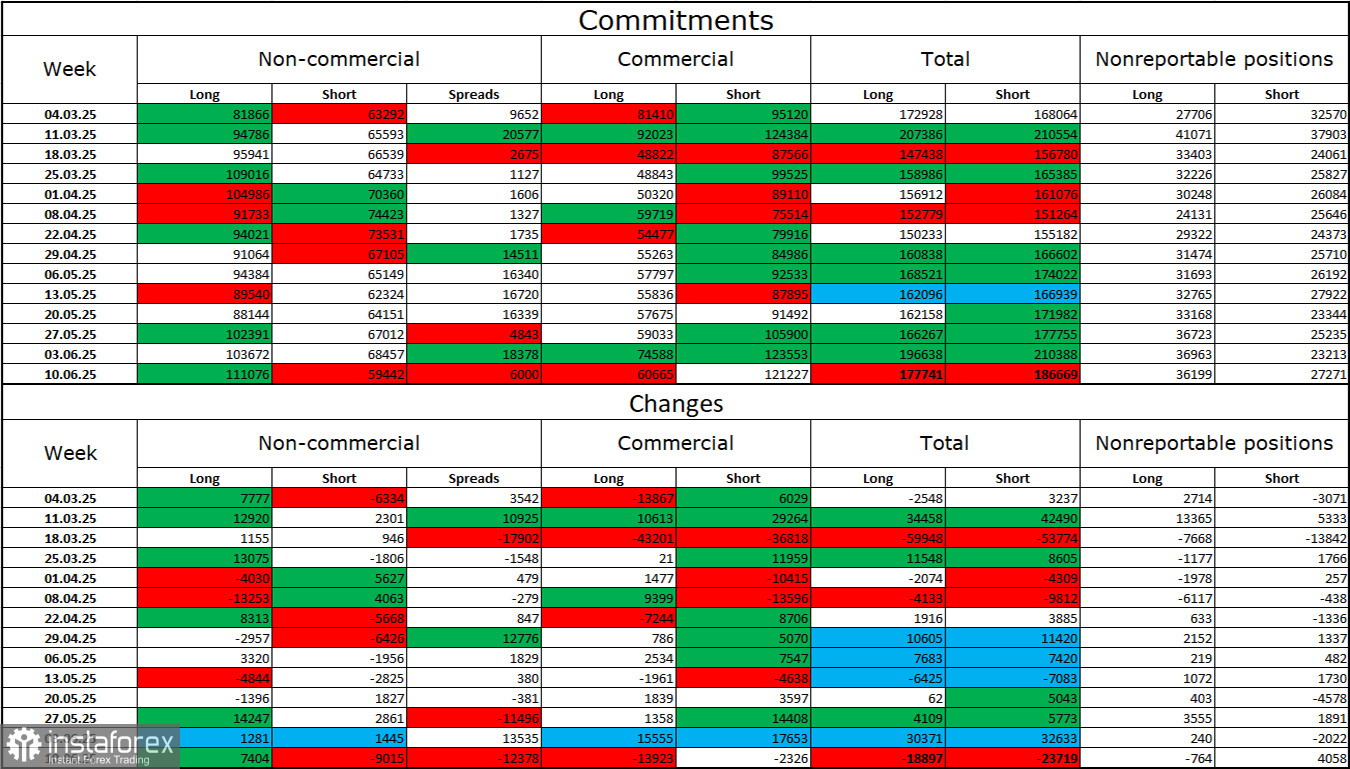
Sentiment among non-commercial traders became much more bullish last week. The number of long positions held by speculators rose by 7,404, while short positions fell by 9,015. Bears have long lost their edge in the market and currently have no realistic path to success. The gap between longs and shorts stands at 51,000 in favor of the bulls: 111,000 vs. 59,000.
In my view, the pound still has downside risks, but recent events have shifted the market's longer-term outlook. Over the past three months, the number of long positions has risen from 65,000 to 111,000, while shorts have dropped from 76,000 to 59,000. Under Donald Trump, confidence in the dollar has weakened, and the COT data shows traders are reluctant to buy it. Regardless of broader news flow, the dollar continues to decline against the backdrop of Trump's policies.
At least four important events are on Wednesday's calendar. The news flow is likely to significantly influence trader sentiment throughout the day.
Selling the pair was possible after a bounce from the 1.3611–1.3620 resistance zone, with an initial target at 1.3527. This target may be reached today, along with the next one at 1.3444. New short positions are possible if the pair closes below the 1.3425–1.3444 zone, targeting 1.3357–1.3373. I recommend considering long positions on a bounce from the 1.3425–1.3444 zone, with a target of 1.3527.
Fibonacci levels are plotted from 1.3446 to 1.3139 on the hourly chart and from 1.3431 to 1.2104 on the 4-hour chart.


