
 19.06.2025 11:13 AM
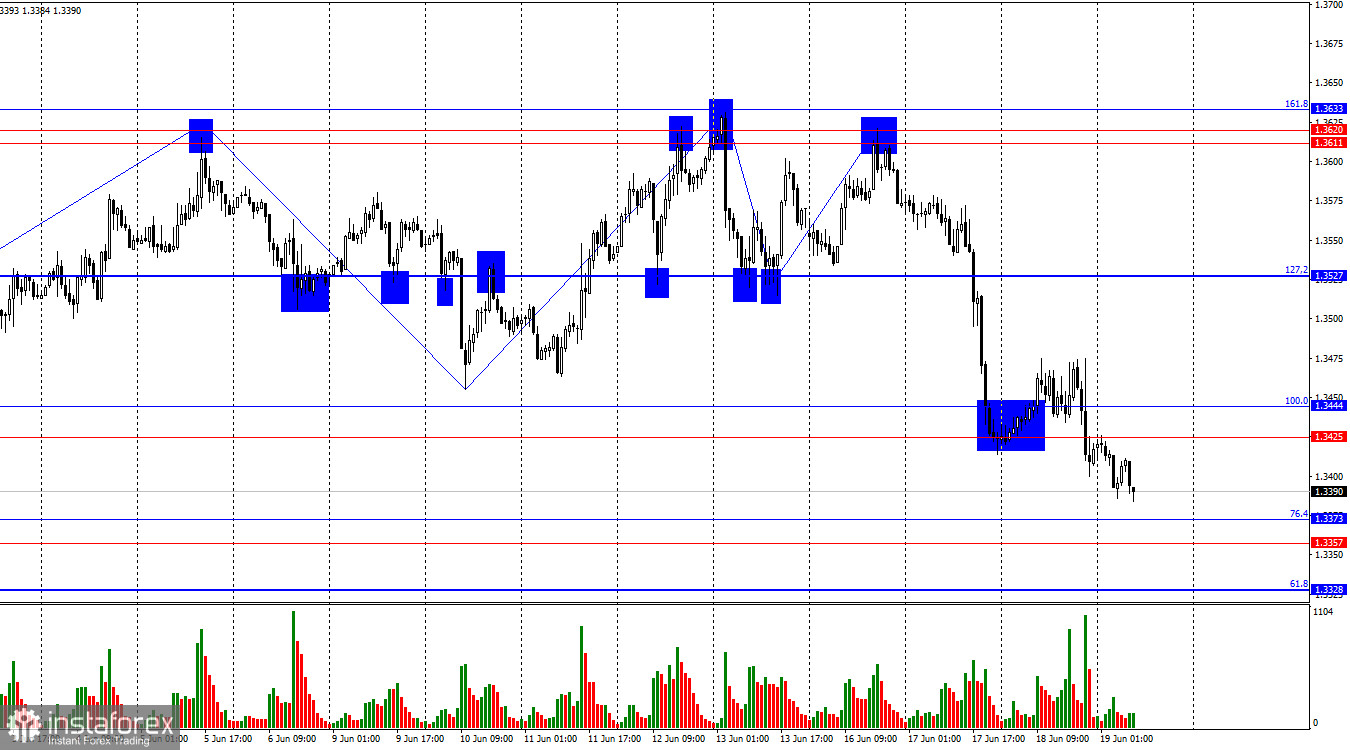
On the hourly chart, the GBP/USD pair continued its decline on Tuesday and Wednesday after bouncing off the resistance zone of 1.3611–1.3633 and closed below the support zone of 1.3425–1.3444. Thus, the decline may continue today toward the support zone of 1.3357–1.3373. However, it's worth noting that the Bank of England's meeting results will be announced in a few hours, which may change market sentiment. In my view, the dollar has already exceeded its growth expectations over the past few days.
The wave pattern indicates the end of the "bullish" trend. The last upward wave did not break above the previous wave's peak, while the last downward wave broke below the previous low. Bulls continue to struggle to support further growth without new negative news from the U.S. president, so for now, they have temporarily retreated. I assume this retreat may not last long.
On Wednesday, there was no news from Donald Trump, and the FOMC meeting only slightly aided the bears. A few days ago, Trump indicated that negotiations with Iran over the nuclear deal had failed, stating that "their time is up." Since then, the media has been actively speculating that the U.S. may strike Iran's military and nuclear facilities in the coming days. Trump has repeatedly stated that Iran cannot and will not possess nuclear weapons. As we can see, these were not just words. It is also reported that an attack plan on Iran has already been formed and approved by the U.S. president, but Trump is still hesitating to give the order, hoping that Tehran will ultimately abandon its nuclear program.
The Bank of England meeting is scheduled for today and is expected to be just as uneventful as the FOMC meeting on Wednesday evening. Traders do not expect a rate cut, as one already occurred just a month and a half ago. Moreover, the Bank of England is not in a position to cut rates at every meeting—inflation remains too high.
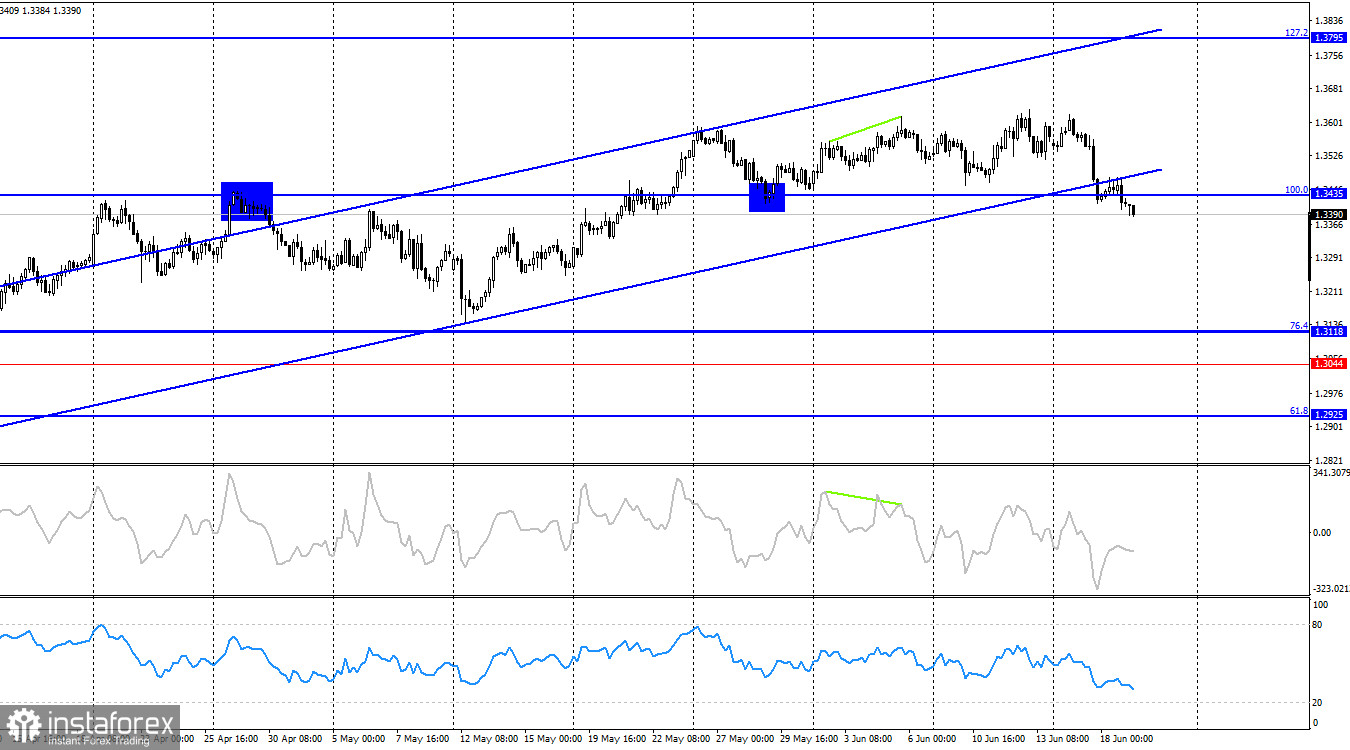
On the 4-hour chart, the pair returned to the 100.0% Fibonacci level at 1.3435 and consolidated below it. Thus, the decline may continue toward the next corrective level of 76.4% – 1.3118. Bears also managed to break below the ascending trend channel. The trend may now be shifting to "bearish," although I do not currently anticipate a strong decline in the British pound. No imminent divergences are forming on any indicators today.
Commitments of Traders (COT) Report:
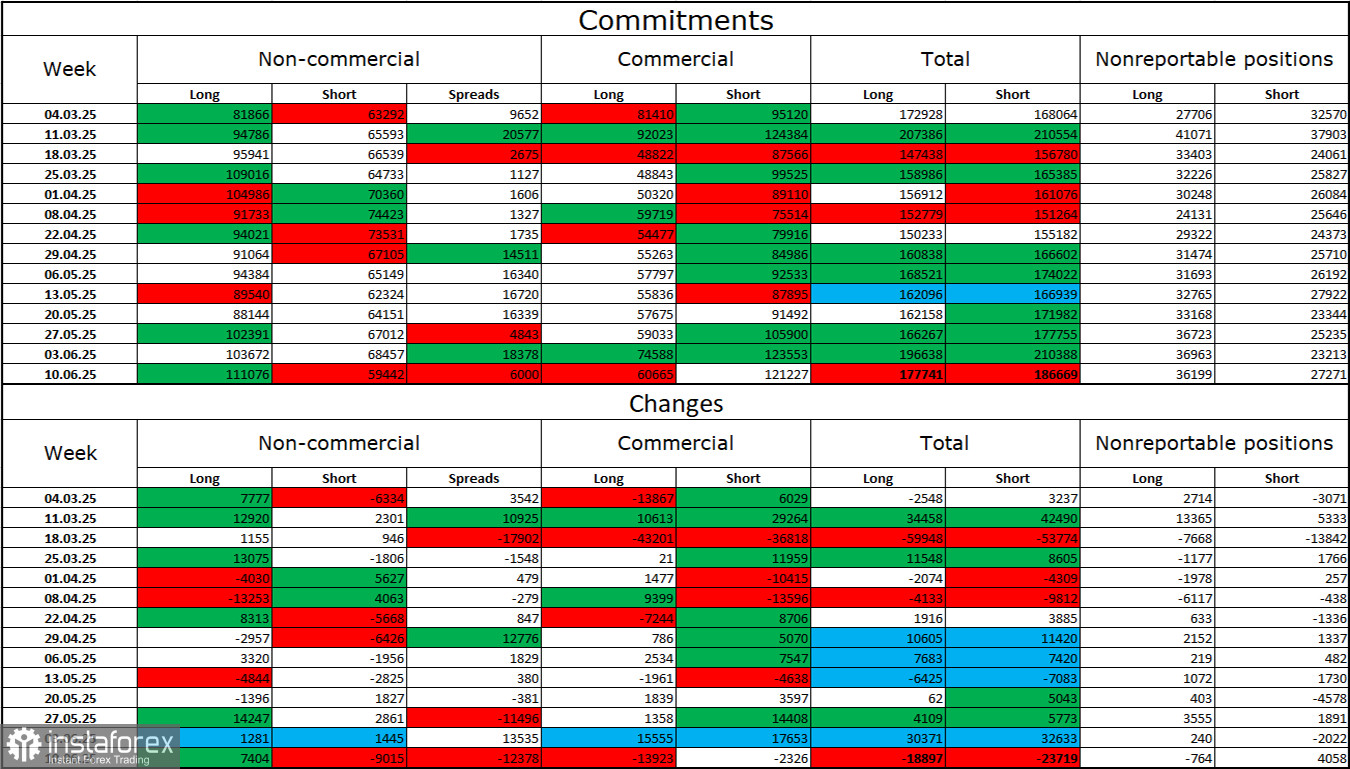
Sentiment among the "Non-commercial" trader category became significantly more bullish in the latest reporting week. The number of long positions held by speculators rose by 7,404, while short positions fell by 9,015. Bears have long lost their advantage in the market and now have little chance of success. The gap between long and short positions is 51,000 in favor of the bulls: 111,000 vs. 59,000.
In my view, the pound still faces downside risks, but recent developments have shifted the long-term market outlook. Over the past three months, the number of long positions has increased from 65,000 to 111,000, while shorts have declined from 76,000 to 59,000. Under Donald Trump, confidence in the dollar has weakened, and the COT reports show that traders have little appetite for buying the greenback. Therefore, regardless of the overall news backdrop, the dollar has only been falling amid developments related to Trump.
News Calendar for the U.S. and the U.K.:
On Thursday, the economic calendar includes three key events. The impact of the news background on trader sentiment may be significant in the coming hours.
GBP/USD Outlook and Trading Recommendations:
Selling the pair was possible after a rebound from the resistance zone of 1.3611–1.3620 with targets at 1.3527 and 1.3444. New selling opportunities arose after a close below the 1.3425–1.3444 zone, targeting 1.3357–1.3373. Buying is advisable from a bounce off the 1.3357–1.3373 zone or a close above 1.3425–1.3444 with a target at 1.3527.
The Fibonacci grids are drawn from 1.3446 to 1.3139 on the hourly chart and from 1.3431 to 1.2104 on the 4-hour chart.


