Actual patterns

Patterns are graphical models which are formed in the chart by the price. According to one of the technical analysis postulates, history (price movement) repeats itself. It means that the price movements are often similar in the same situations which makes it possible to predict the further development of the situation with a high probability.
Relevant patterns by InstaTrade is an easy-to-use service which allows you to be aware of latest changes in the market and react to clues from the market in time. In our service you will always find the latest and most relevant patterns on any pair and any timeframe.
Double Top
was formed on 21.05 at 19:05:15 (UTC+0)
signal strength 1 of 5
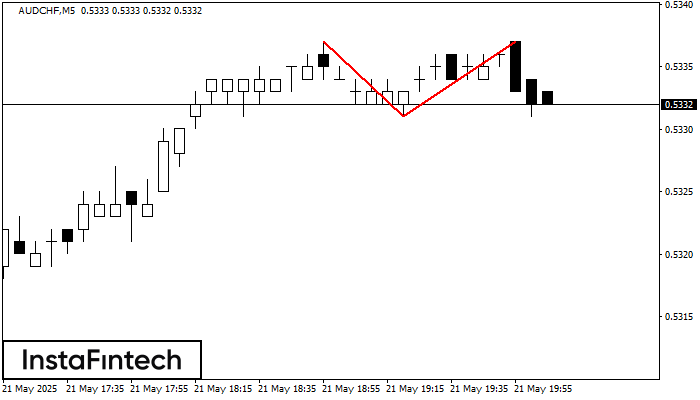
On the chart of AUDCHF M5 the Double Top reversal pattern has been formed. Characteristics: the upper boundary 0.5337; the lower boundary 0.5331; the width of the pattern 6 points. The signal: a break of the lower boundary will cause continuation of the downward trend targeting the 0.5316 level.
The M5 and M15 time frames may have more false entry points.
See Also
- All
- All
- Bearish Rectangle
- Bearish Symmetrical Triangle
- Bearish Symmetrical Triangle
- Bullish Rectangle
- Double Top
- Double Top
- Triple Bottom
- Triple Bottom
- Triple Top
- Triple Top
- All
- All
- Buy
- Sale
- All
- 1
- 2
- 3
- 4
- 5
Double Top
was formed on 20.06 at 11:36:01 (UTC+0)
signal strength 1 of 5
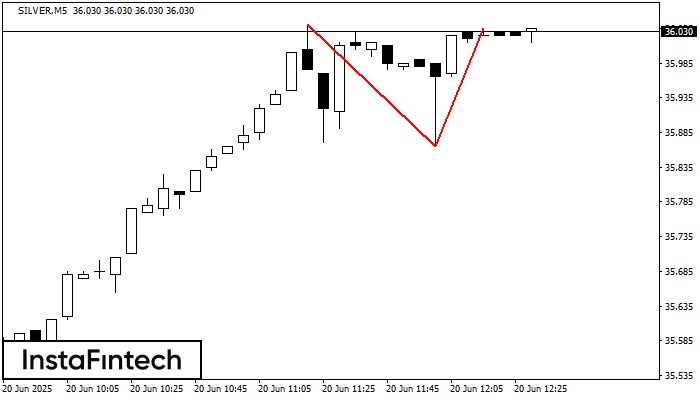
On the chart of SILVER M5 the Double Top reversal pattern has been formed. Characteristics: the upper boundary 36.03; the lower boundary 35.87; the width of the pattern 170 points
The M5 and M15 time frames may have more false entry points.
Open chart in a new window
Inverse Head and Shoulder
was formed on 20.06 at 10:21:06 (UTC+0)
signal strength 1 of 5
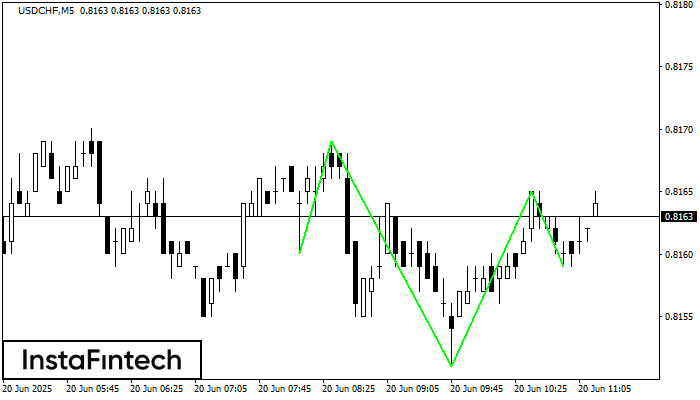
According to M5, USDCHF is shaping the technical pattern – the Inverse Head and Shoulder. In case the Neckline 0.8169/0.8165 is broken out, the instrument is likely to move toward
The M5 and M15 time frames may have more false entry points.
Open chart in a new window
Bearish Rectangle
was formed on 20.06 at 10:10:53 (UTC+0)
signal strength 1 of 5
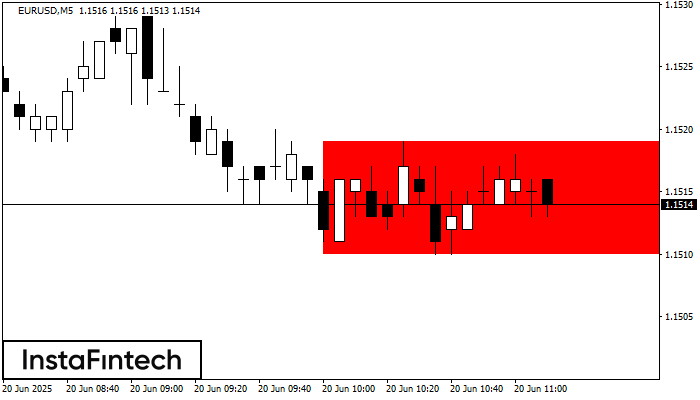
According to the chart of M5, EURUSD formed the Bearish Rectangle. The pattern indicates a trend continuation. The upper border is 1.1519, the lower border is 1.1510. The signal means
The M5 and M15 time frames may have more false entry points.
Open chart in a new window