See also

 02.05.2025 08:04 AM
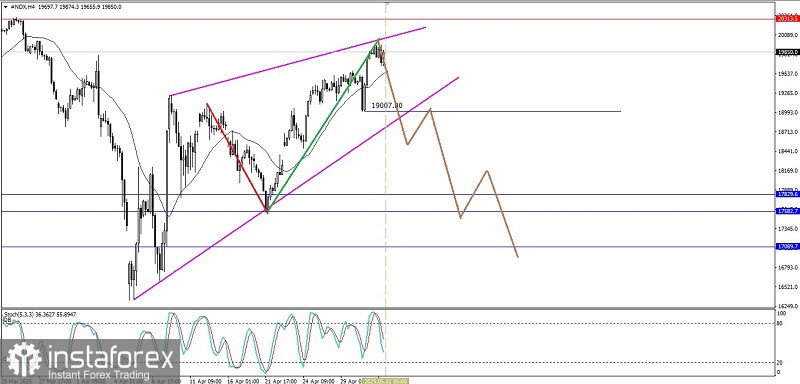
From what is seen on the 4-hour chart of the Nasdaq 100 index, the Stochastic Oscillator indicator is in a Crossing SELL condition and the appearance of a Rising Wedge pattern so that based on these two conditions in the near future #NDX has the potential to weaken down where the level of 19007.00 will be tested to be broken and close below it if successful then #NDX has the potential to continue its weakening to the level of 17582.7 as its first target and if the momentum and volatility support it then 17089.7 will be the next target to be aimed for but if on its way to these targets suddenly #NDX moves up again to break and close above the level of 20313.5 then all the weakening scenarios on #NDX that have been described previously will be invalid and automatically canceled by themselves.
(Disclaimer)
You have already liked this post today
*The market analysis posted here is meant to increase your awareness, but not to give instructions to make a trade.


