See also

 12.06.2025 08:10 AM
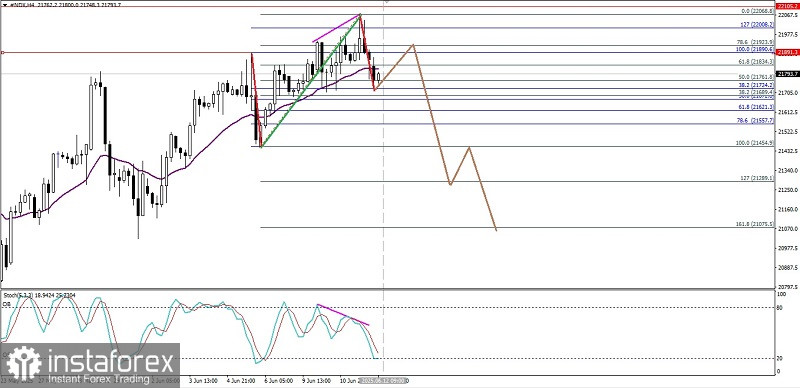
On the 4-hour chart of the Nasdaq 100 index, there is a divergence between its price movement and the Stochastic Oscillator indicator, especially with the current confirmation of the price movement of #NDX which is moving below the EMA (21), then the greater the possibility for the index to weaken in the near future to the level of 21454.9, and if this level is successfully broken and closes below it, then #NDX will continue to weaken again to the level of 21075.5, but all of these weakening scenarios can be invalid if on its way to the target levels, #NDX suddenly strengthens again until it breaks through and closes above the level of 22068.8.
(Disclaimer)
You have already liked this post today
*The market analysis posted here is meant to increase your awareness, but not to give instructions to make a trade.


