See also

 24.07.2025 05:53 AM
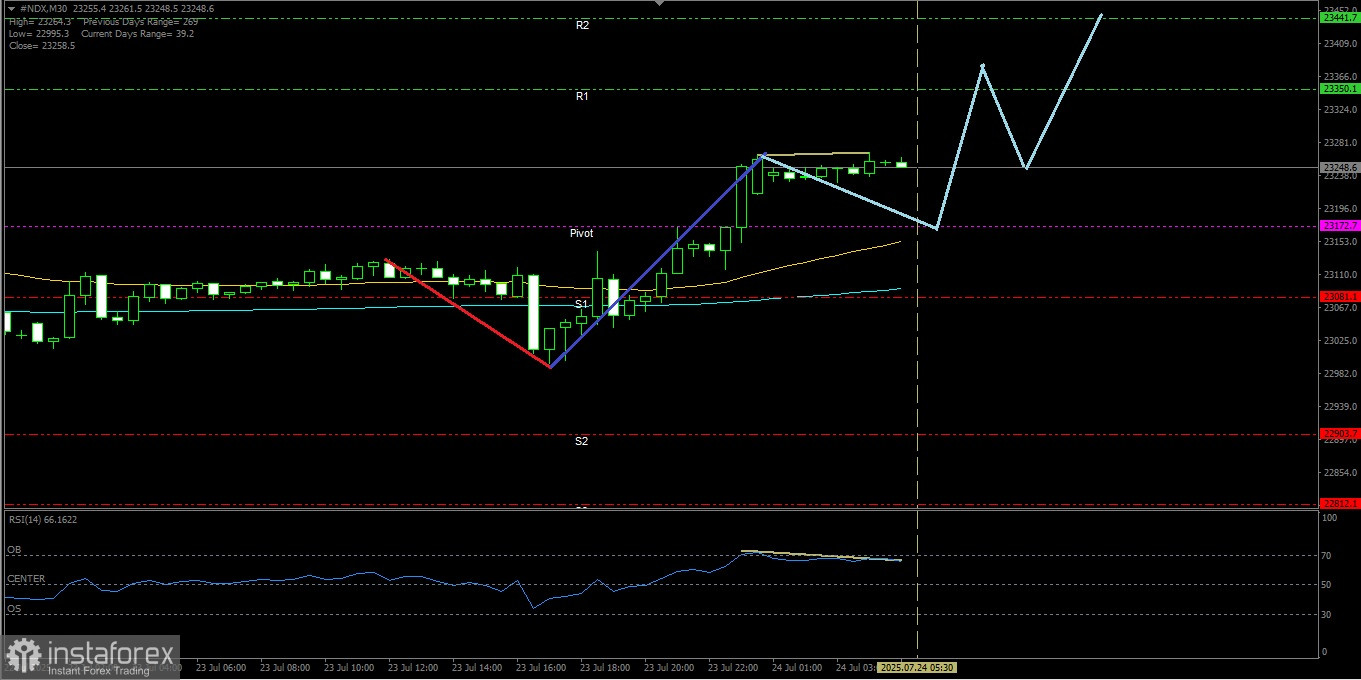
Nasdaq 100 Index – Thursday, July 24, 2025.
By the appearance of divergence between the Nasdaq 100 Index price movement and the RSI(14) indicator indicates that #NDX has the potential for a limited correction in the near future, as buyers remain dominant in this index due to the Golden Cross EMA(50) which is above the EMA(200).
Key Levels
1. Resistance 2: 23441.7.
2. Resistance 1: 23350.1.
3. Pivot: 23172.7.
4. Support 1: 23081.1.
5. Support 2: 22903.7.
Tactical Scenario
Positive Reaction Zone: If the index price successfully breaks through and closes above 23350.1, it has the potential to continue strengthening to the levels 23441.7.
Momentum Extension Bias: If the 23441.7 level is successfully broken through and closes above it, the #NDX will continue strengthening to 23619.1 if momentum and volatility support it.
Invalidation Level / Bias Revision
Upside bias weakens when the Nasdaq 100 index price breaks through and closes below 22903.7.
Technical Summary
EMA(50): 23091.6.
EMA(200): 23152.6.
RSI(14): 66.16.
Economic News Release Agenda:
Supported by the strengthening of AI and Technology stock issuers with high optimism from investors today, the potential for a boost is expected, today the release of economic data from the United States:
US Unemployment Claims - 7:30 PM WIB.
US Flash Manufacturing PMI - 8:45 PM WIB.
US Flash Services PMI - 8:45 PM WIB.
US New Home Sales - 9:00 PM WIB.
US Natural Gas Storage - 9:30 PM WIB.
You have already liked this post today
*The market analysis posted here is meant to increase your awareness, but not to give instructions to make a trade.


