See also

 02.05.2025 03:47 AM
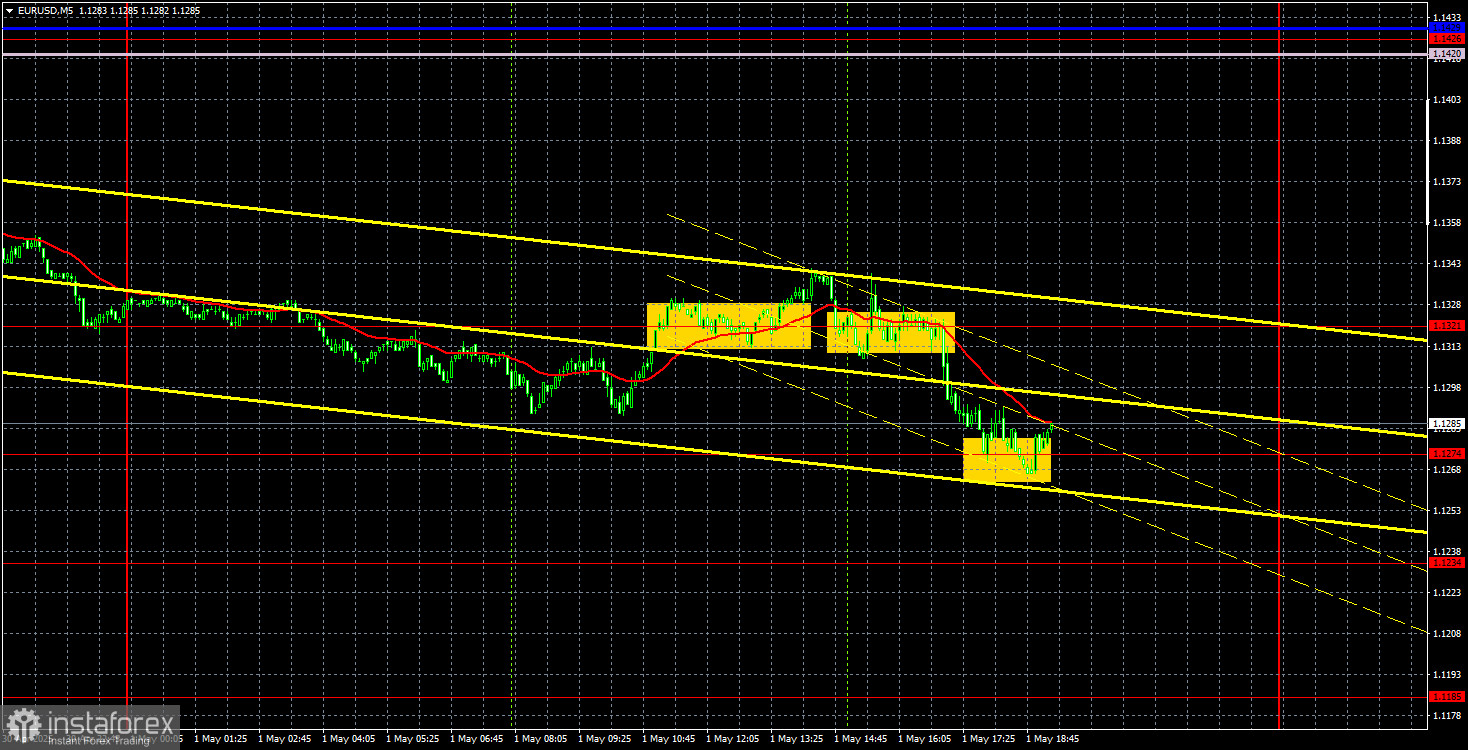
The EUR/USD currency pair continued its mild upward movement on Thursday. The ongoing rise of the U.S. dollar looks strange, but strange price behavior has become the norm in recent months. Let's recall: the market continues to ignore the macroeconomic backdrop completely. On Monday, there was no news, yet the dollar dropped sharply. On Tuesday, the U.S. JOLTS report came in weak, but the dollar strengthened. On Wednesday, U.S. GDP and labor market data disappointed, but the dollar kept rising. On Thursday, the ISM Manufacturing PMI declined again, yet the dollar continued its ascent. In short, there's still no sign of logical or consistent market behavior.
What saves the current technical picture is that the price remains within the sideways channel of 1.1274–1.1426. Thus, the three-day dollar rally is simply part of the broader flat range — and within a flat, the price doesn't need any particular reason to move up or down. It's also worth noting that Donald Trump couldn't have triggered the dollar's strength, as there have been no new developments this week regarding the global trade war.
Trading signals on Thursday once again left much to be desired. One day, decent setups are present, and the next, traders completely ignore technical references. But in the context of a flat, this is somewhat forgivable. At this point, we recommend closely watching the 1.1274 level. If it is confidently broken, the dollar may continue its recovery after a two-month, 1,000-pip decline.
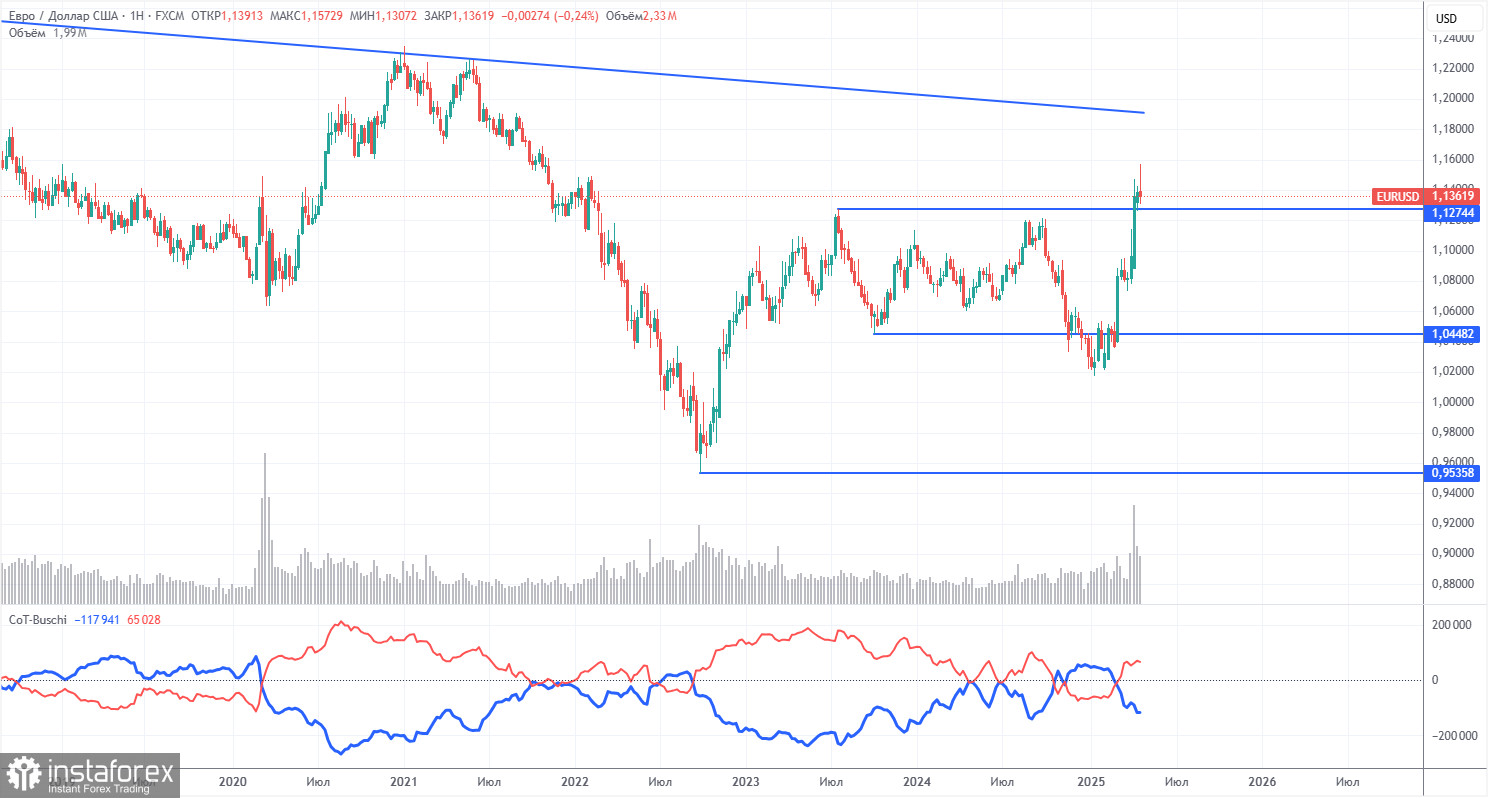
As shown in the chart above, the net position of non-commercial traders remained bullish for a long time. The bears barely managed to move into dominance but quickly lost it. Since Trump took office as U.S. President, the dollar has fallen into an abyss.
We cannot definitively say that the decline of the American currency will continue, and the COT reports reflect the true sentiment of major players, which can also change very quickly in the current circumstances.
We still do not see any fundamental factors for strengthening the European currency, but one very significant factor remains for the fall of the U.S. dollar. The pair may correct for a few more weeks or months, but a 16-year downtrend won't be reversed so quickly.
The red and blue lines have crossed again, so the trend in the market is now bullish once more. Over the last reporting week, the number of longs from the "Non-commercial" group decreased by 900, and the number of shorts increased by 3,300. Accordingly, the net position decreased by 4,200 contracts.
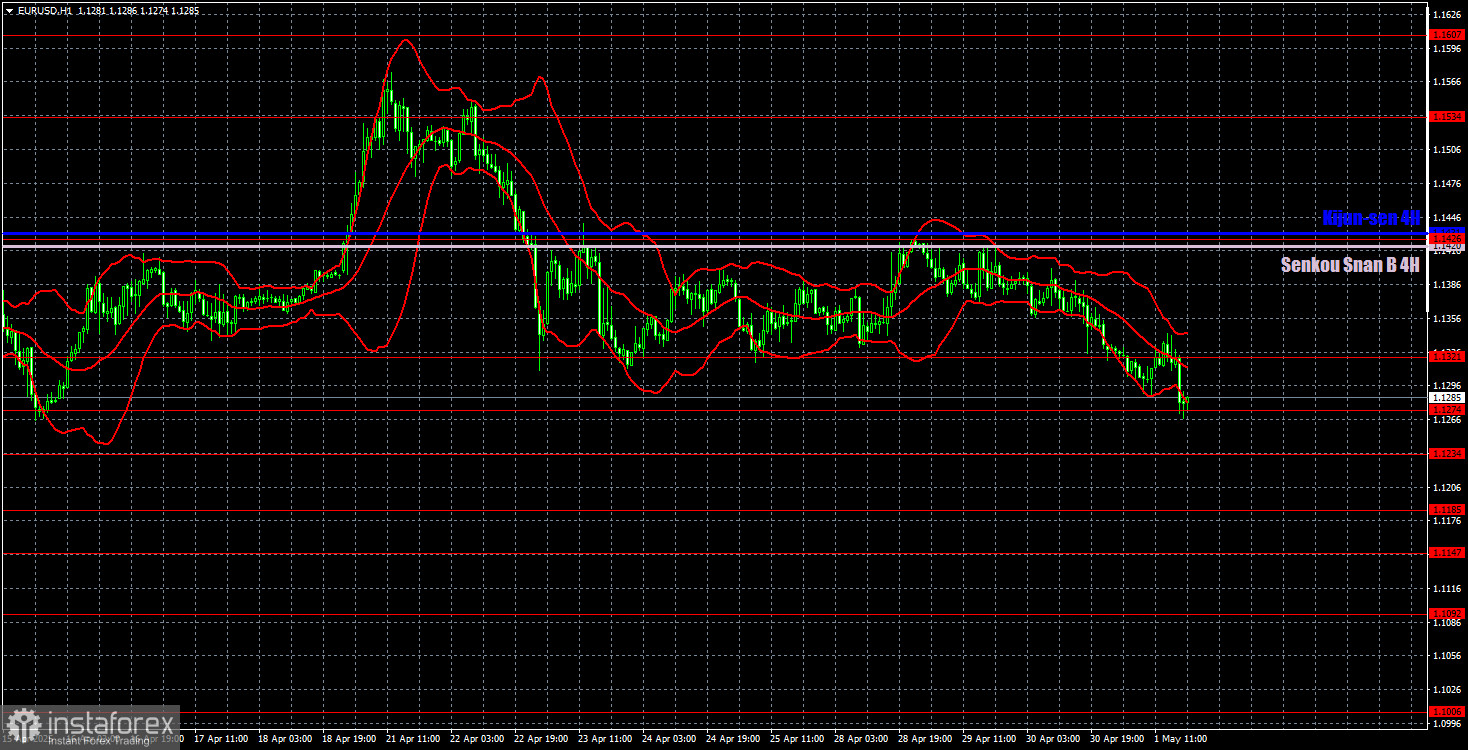
On the hourly timeframe, the EUR/USD pair continues to show a bullish bias, but it has been trading in a sideways range in recent weeks due to the absence of updates on Trump's trade policies. There is currently very little logic or technical structure across any timeframe, and the macroeconomic backdrop continues not to influence the pair's movement. The market is waiting for news on the trade war — escalation or de-escalation — and is not prepared to commit to any clear direction until that arrives.
Key levels for trading on May 2: 1.0823, 1.0886, 1.0949, 1.1006, 1.1092, 1.1147, 1.1185, 1.1234, 1.1274, 1.1321, 1.1426, 1.1534, 1.1607, 1.1666, as well as Senkou Span B (1.1420) and Kijun-sen (1.1428) lines. Note: Ichimoku indicator lines can shift throughout the day and should be considered when identifying trade signals. Don't forget to set Stop Loss to breakeven after a 15-pip move in your favor — this helps protect against potential losses if the signal proves false.
The Eurozone's April CPI (second estimate) is scheduled for release on Friday. Objectively, this report is unlikely to grab trader attention, as second estimates rarely differ from the first. However, in the U.S., non-farm payrolls and the unemployment rate will be released. If the market ignores these as well, we won't be surprised. Expectations for these figures aren't high, so the dollar could come under pressure again, especially considering that it is currently trading near the lower boundary of the flat range.


