See also

 02.05.2025 03:50 AM
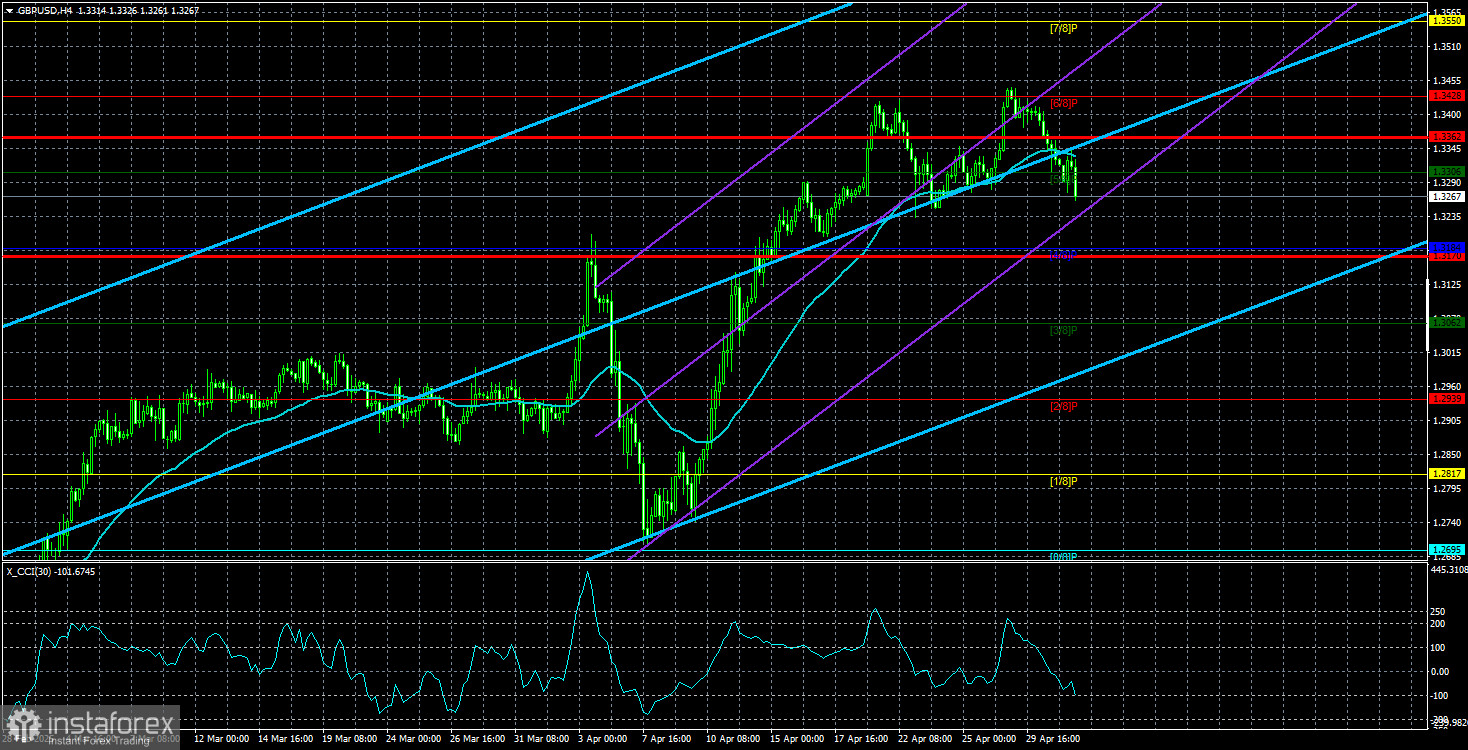
On Thursday, the GBP/USD currency pair continued to decline. The dollar had strengthened for three consecutive days—despite having no objective reason. U.S. macroeconomic data has been consistently weak; there were no UK data releases and no positive news regarding the de-escalation of the global trade conflict. Naturally, the dollar can't fall forever, and it's quite possible that what we saw was simply a technical correction triggered by profit-taking on long positions. If that's the case, the decline in the U.S. dollar could resume as early as today. It is challenging to anticipate strong figures from today's Non-Farm Payrolls and unemployment reports.
The U.S. dollar hadn't even had time to properly rally before analysts began to panic. "How can this be? There are no reasons for the dollar to rise, but it's rising!" Theories began circulating, each more creative than the last. On Thursday, some experts claimed the dollar was strengthening on expectations of a trade deal between China and the U.S. However, several Chinese officials have stated in recent weeks that no talks have been held with Trump. If China isn't negotiating, then it's doubtful the U.S. is either. There aren't consultations on future talks at the moment—so what deal are we talking about?
Of course, Trump continues to promote the "upcoming agreement" with China in the media, but we've often said that Trump's words must be taken with a grain of salt—more like a fistful. According to him, the era of prosperity has already begun, and anyone paying attention to the GDP report is a traitor. There will be a deal with China, but when will it be? "Doesn't matter," he says. Let's not forget that Trump also promised to end the war in Ukraine within 24 hours of his inauguration. It's been 100 days, and now he claims that was meant "figuratively." We won't be surprised if a year from now, he says that "Make America Great Again" was also just a metaphor—or that he was misunderstood.
And let's not forget about Joe Biden, who, according to Trump, is "responsible for everything." This week, Trump seriously claimed that the decline in the U.S. stock market is Biden's fault. It's hard to say how one is supposed to react to such statements.
Meanwhile, the British pound may continue rising—without making any effort. Trump is doing all the work. In the past, for the pound to grow, we needed strong UK data or a hawkish tone from the Bank of England. Not anymore. The market is focused on one word: "Trump"—and that alone is enough to keep dragging the dollar into the abyss.
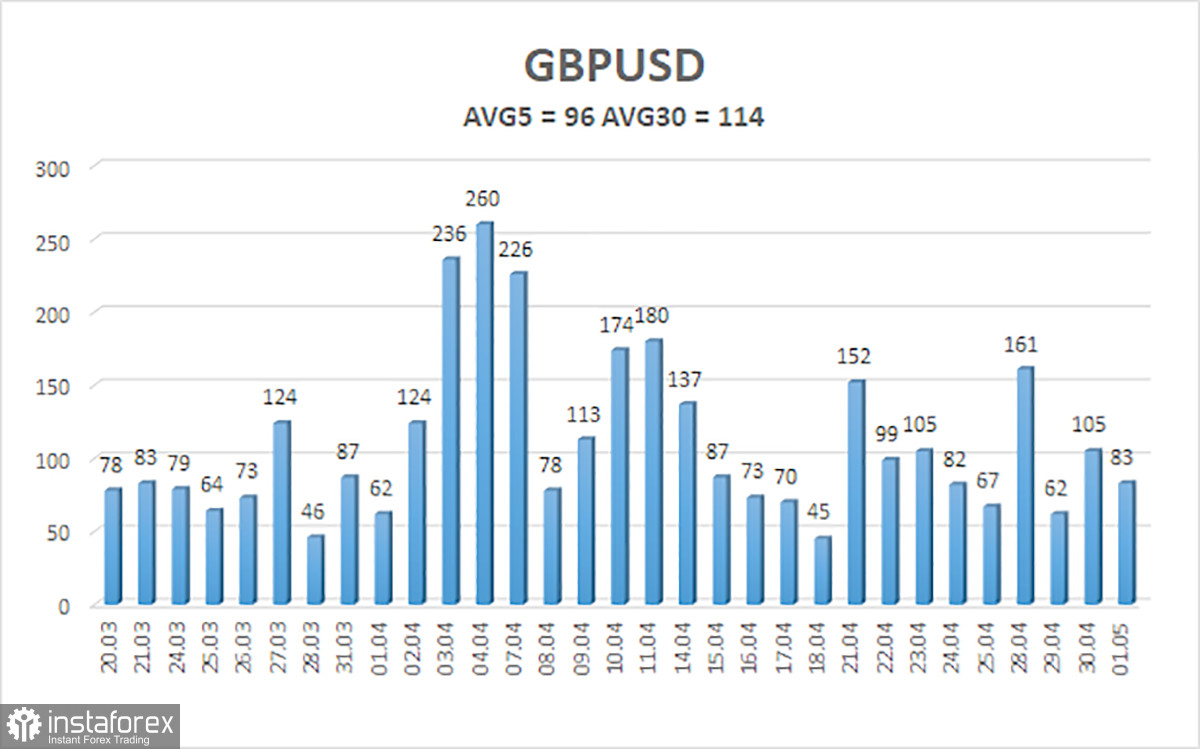
The average volatility for GBP/USD over the last five trading days is 96 pips, which is classified as "moderate" for this pair. On Friday, May 2, we expect price movement from 1.3170 to 1.3362. The long-term regression channel points upward, indicating a clear bullish trend. The CCI indicator has formed a bearish divergence, which triggered the current correction.
S1 – 1.3306
S2 – 1.3184
S3 – 1.3062
R1 – 1.3428
R2 – 1.3550
R3 – 1.3672
The GBP/USD pair maintains its uptrend but has now consolidated below the moving average. We continue to believe that the pound has no fundamental reason to grow. It's not the pound that's rising—it's the dollar that's falling. And it's falling solely because of Trump. His actions can as easily provoke a sharp downward reversal. If you're trading based on pure technicals or the "Trump effect," then long positions remain relevant with targets at 1.3428 and 1.3550 as long as the price remains above the moving average. Sell orders also remain attractive, with initial targets at 1.3184 and 1.3170. Still, the recent three-day rally in the U.S. dollar has raised a few eyebrows. It seems we're simply witnessing a technical correction.
Linear Regression Channels help determine the current trend. If both channels are aligned, it indicates a strong trend.
Moving Average Line (settings: 20,0, smoothed) defines the short-term trend and guides the trading direction.
Murray Levels act as target levels for movements and corrections.
Volatility Levels (red lines) represent the likely price range for the pair over the next 24 hours based on current volatility readings.
CCI Indicator: If it enters the oversold region (below -250) or overbought region (above +250), it signals an impending trend reversal in the opposite direction.


