See also

 02.05.2025 06:31 AM
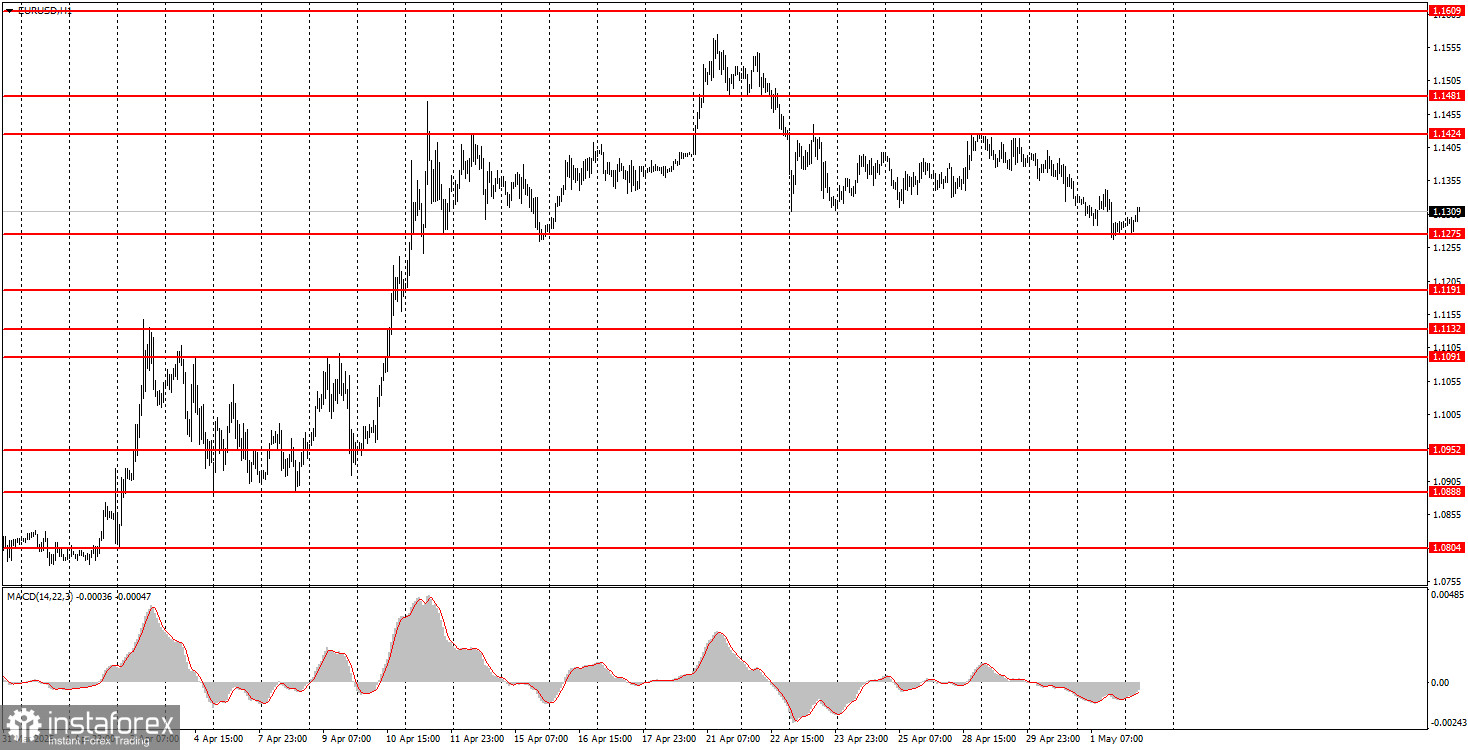
On Thursday, the EUR/USD currency pair continued its downward movement and reached the 1.1275 level by the end of the day, which serves as the lower boundary of the sideways channel the pair has been trading within for more than three weeks. We've zoomed out the chart specifically to highlight this range. It's important to note that the brief breakout above this channel at the beginning of last week was anomalous and is not considered in the analysis.
Thus, the dollar's three-day rally appears baseless. Donald Trump has neither lifted nor reduced any tariffs, no hawkish news from the Federal Reserve, and nearly all U.S. macroeconomic data this week has been a disappointment. Therefore, we are inclined to interpret this movement as a purely technical retracement within the flat. A bounce from 1.1275 could trigger a rise toward 1.1424, the upper boundary of the range. Only a confirmed breakout below 1.1275 would suggest that the market has priced in the dollar's decline and no longer expects a fresh escalation in Trump's trade war.
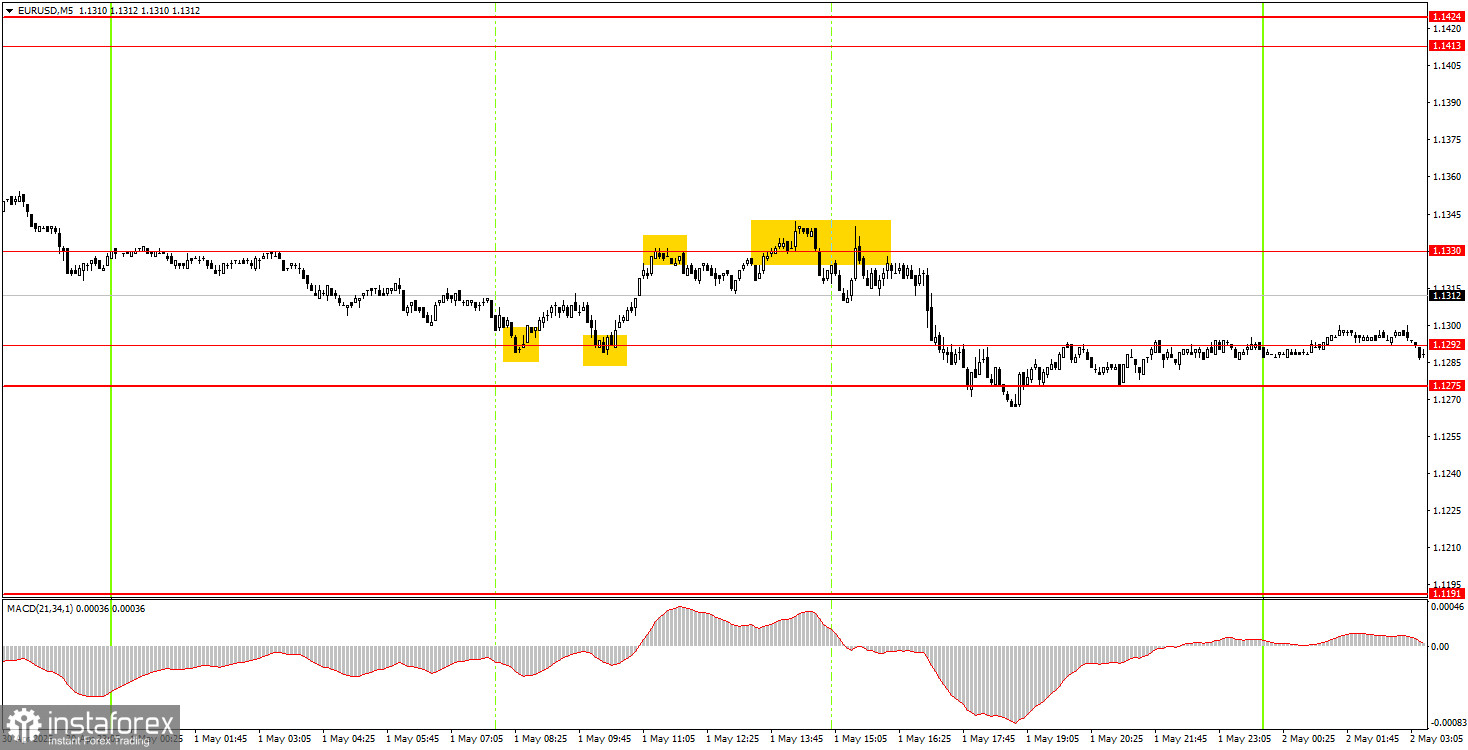
On Thursday, several trading signals were formed in the 5-minute timeframe, as shown in the illustration above. Volatility was weak, so the quality of these signals was not very high. Some small gains could have been made, but overall, the market remains choppy, and the flat on the hourly chart persists.
On the hourly timeframe, EUR/USD maintains a bullish bias, but excluding last week's volatility, the pair has been flat near highs for the past three weeks. The market remains highly bearish on the dollar and broadly negative on all things American, but should Trump initiate a de-escalation of the trade conflict he started, the dollar may regain some strength. When or if that happens, however, is unknown.
On Friday, the pair could move in either direction again, as market behavior is still largely dictated by Trump's statements and decisions. We believe the flat will continue for now. A bounce from the lower boundary (1.1275) could lead to upward movement.
On the 5-minute timeframe, the following levels should be considered: 1.0940–1.0952, 1.1011, 1.1091, 1.1132–1.1140, 1.1189–1.1191, 1.1275–1.1292, 1.1330, 1.1413–1.1424, 1.1474–1.1481, 1.1513, 1.1548, 1.1571, 1.1607–1.1622, 1.1666, 1.1689. The Eurozone will release its inflation report on Friday, but this will only be the second estimate for April, which typically draws little market attention. Far more important data will be released in the second half of the day—namely, the U.S. NonFarm Payrolls and unemployment rate. However, the market may easily overlook even these reports.
Support and Resistance Levels: These are target levels for opening or closing positions and can also serve as points for placing Take Profit orders.
Red Lines: Channels or trendlines indicating the current trend and the preferred direction for trading.
MACD Indicator (14,22,3): A histogram and signal line used as a supplementary source of trading signals.
Important Events and Reports: Found in the economic calendar, these can heavily influence price movements. Exercise caution or exit the market during their release to avoid sharp reversals.
Note for Beginner Forex Traders: Not every trade can be profitable. Developing a clear strategy and sound money management is key to long-term success in trading.


