See also

 02.05.2025 12:14 PM
In my morning forecast, I focused on the 1.3313 level and planned to make trading decisions from there. Let's take a look at the 5-minute chart and break down what happened. A rise followed by a false breakout around 1.3313 offered a good entry point for short positions, resulting in a drop of over 40 points. The technical outlook was revised for the second half of the day.
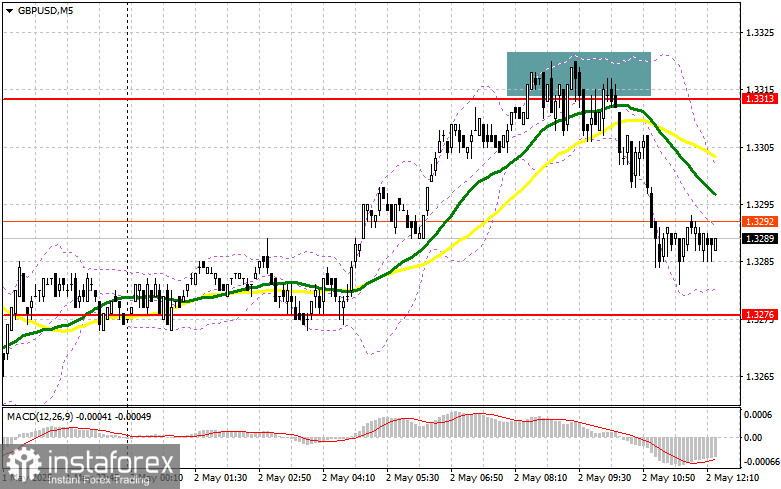
The upcoming U.S. data on nonfarm payrolls, unemployment rate, and average hourly earnings will likely influence the pair's further direction. A significant deviation from forecasts could push the Federal Reserve to act differently. If the market reacts bearishly to the data, I expect the first buyer interest to appear around the new support level at 1.3276, formed in the first half of the day. A false breakout there would provide a good entry point for long positions targeting the resistance at 1.3316, which the pair failed to break earlier.
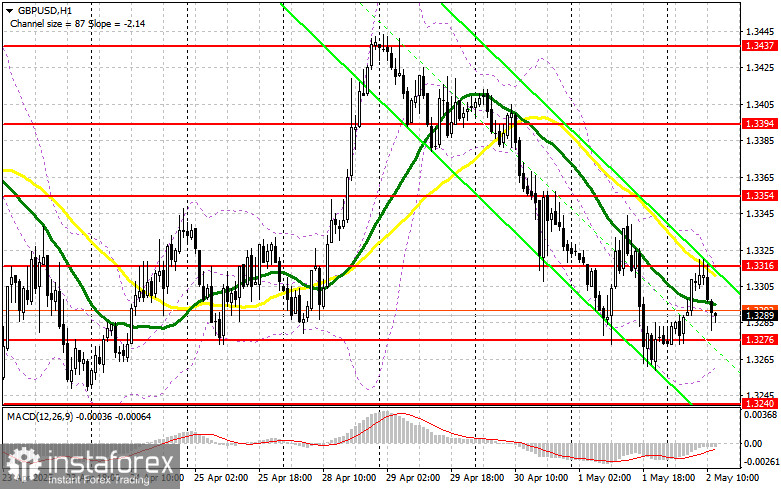
A breakout and retest of this level from above would open a new entry point for longs with the prospect of a rise toward 1.3354—restoring the bullish market. The ultimate target will be the area of 1.3394, where I plan to take profit.
If GBP/USD declines and bulls show no interest at 1.3276 in the second half of the day, pressure on the pound will return. In this case, only a false breakout near 1.3240 would serve as a valid signal to buy. I plan to buy GBP/USD directly on a rebound from support at 1.3205, targeting a 30–35 point intraday correction.
Sellers performed quite well earlier, but further movement will fully depend on the data. If GBP/USD climbs again following weak U.S. figures, I plan to act after a false breakout near the resistance at 1.3316—similar to the earlier example. This is also where the moving averages are located, favoring the bears. This setup will give a good entry point for selling, targeting the support at 1.3276.
A breakout and retest of this level from below would trigger stop-losses, opening the way to 1.3240—a new weekly low. The ultimate target will be the area of 1.3205, where I plan to take profit.
If demand for the pound persists later in the day and bears do not show up near 1.3316, it's best to postpone shorts until the resistance at 1.3354 is tested. I will only open short positions there on a false breakout. If no downward movement is seen there either, I'll look for short opportunities on a rebound from 1.3394, targeting a 30–35 point downward correction.
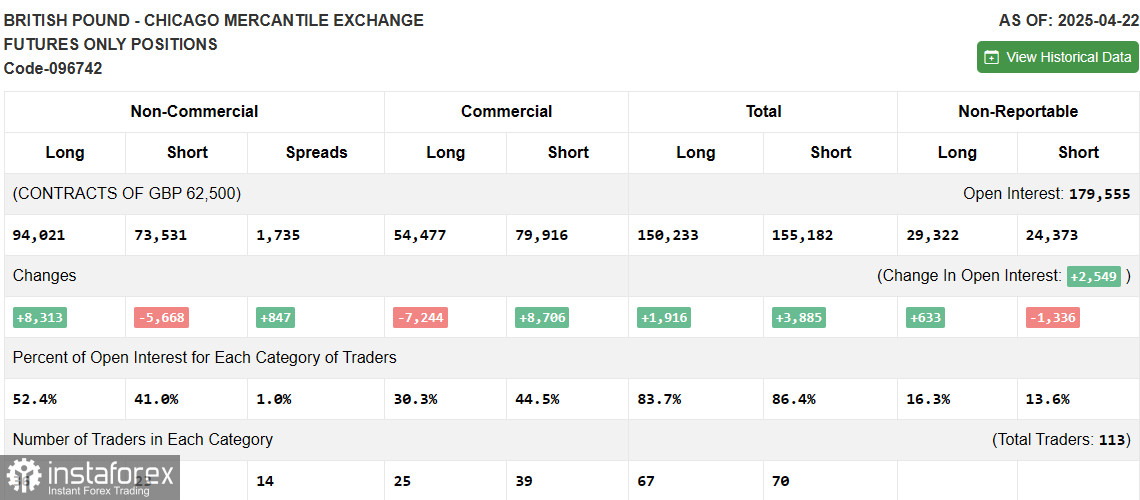
In the Commitment of Traders (COT) report for April 22, there was an increase in long positions and a reduction in shorts. Given that the Bank of England is currently not planning further rate cuts, this supports the pound and allows it to continue strengthening against the U.S. dollar.
However, a potential trade deal between the U.S. and China acts as a limiting factor and helps preserve demand for the dollar. Over the near term, key influences will be U.S. Q1 GDP data and the April jobs report.
According to the latest COT report, long non-commercial positions increased by 8,313 to 94,021 and short non-commercial positions fell by 5,668 to 73,531. The gap between long and short positions increased by 847.
Indicator Signals:
Moving Averages: Trading is occurring below the 30- and 50-day moving averages, indicating a decline in the pound.Note: The moving averages and their values are evaluated by the author on the H1 chart and differ from the classical daily averages on the D1 chart.
Bollinger Bands: If the pair falls, the lower boundary of the indicator around 1.3260 will act as support.
Indicator Descriptions:


