See also

 07.05.2025 03:35 AM
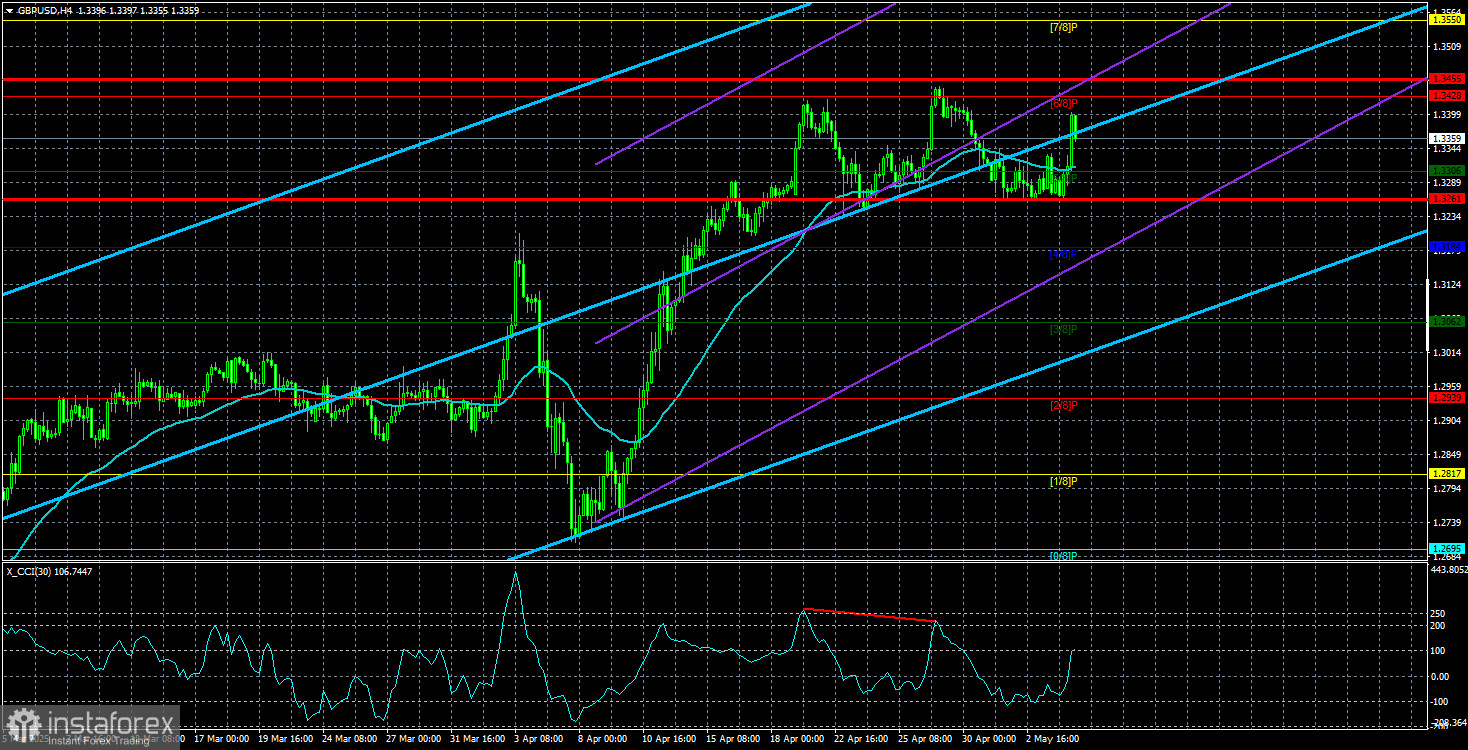
On Tuesday, while the euro remained stuck in a flat trend, the GBP/USD currency pair began a new upward move. The rally started on Monday, but during the U.S. session that day, a reasonably strong ISM Services PMI was released, and for once, the market decided to respond to macroeconomic data. As a result, the pair couldn't show any real gains by Monday's close, but on Tuesday, traders returned with renewed energy. It's worth noting that over the past year or two, the pound sterling has often shown unjustified growth, or has risen more strongly than its peers or beyond what fundamentals would warrant. And in recent months, the U.S. dollar has been falling at every opportunity, so this latest appreciation in the pound is hardly surprising.
Yesterday, the UK released the second estimate of its April Services PMI, which came in at 49.0, down from 52.5 in March. This report wasn't the catalyst behind the pair's upward move. Since there were no other key events, we're inclined to believe this was another case of the dollar weakening due to the "Trump factor." The week began with Donald Trump introducing new tariffs, and hardly anyone still believes his promises of "a trade deal with China coming soon."
Although unofficial, media reports a few weeks ago suggested that Trump was waiting for a phone call from Beijing after imposing 145% tariffs on Chinese goods — a signal to start trade negotiations. We believe this report is accurate because it aligns with Trump's style. In the president's view, every country should grovel before the White House, begging for the privilege to trade with the U.S., and be careful not to anger the "Leader of the American Nation." Trump likely expected Chinese officials to reach out first and ask for talks.
But that didn't happen. Instead, it was revealed yesterday that China received a U.S. proposal to begin negotiations on a trade deal. This information came from China's Ministry of Foreign Affairs and can be considered credible. One could even argue that China has won the first round of the trade standoff. They didn't give in to U.S. pressure and refused to initiate contact, just as Trump had hoped they would. In the end, it was Trump (or someone from his team) who had to send a request for talks. China still holds a firm and fair stance: it's open to trade negotiations, but not to ultimatums, blackmail, or unreasonable demands.
Meanwhile, Trump realizes that halting trade with China is not in America's best interest. So he had to back down, while continuing to tell the American public that Xi Jinping will soon come to Washington asking for a deal—a deal, of course, that will be favorable to the U.S.
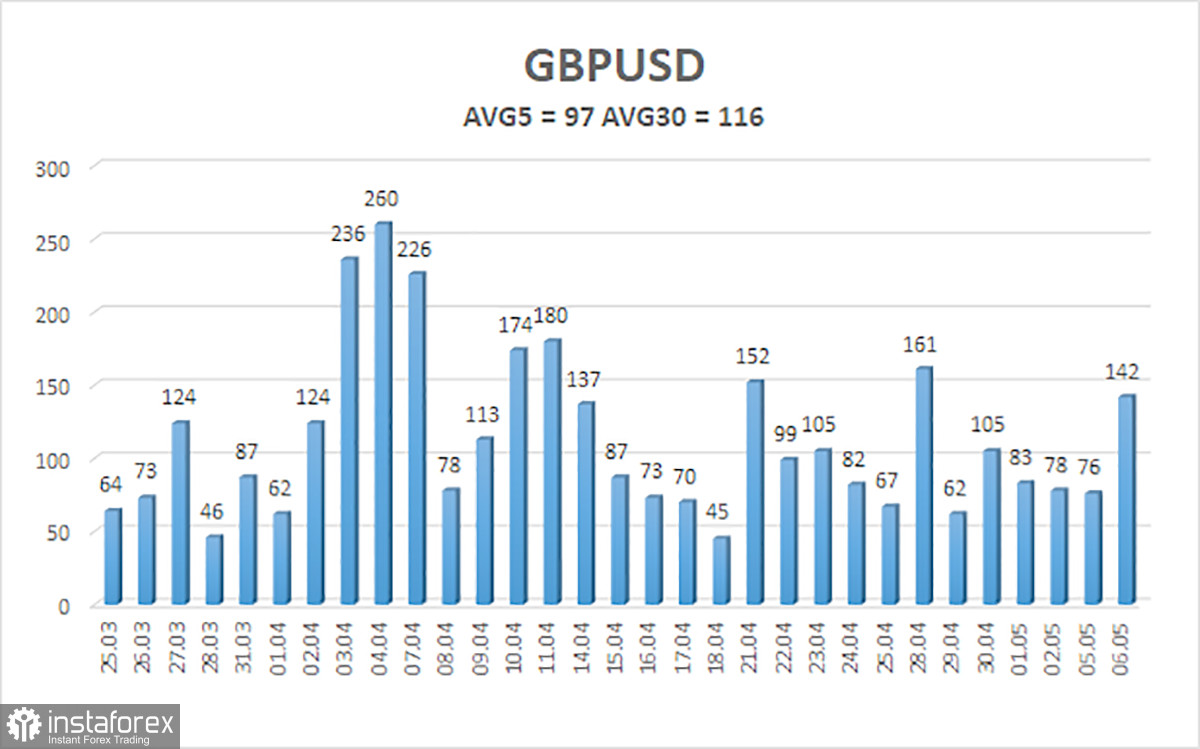
The average volatility for the GBP/USD pair over the past five trading days is 97 pips, which is considered "average" for the pound/dollar pair. On Wednesday, May 7, we expect the pair to move within the range defined by the levels 1.3261 and 1.3455. The long-term regression channel is upward-sloping, which confirms a clear bullish trend. The CCI indicator recently showed a bearish divergence, which led to the latest correction, now completed.
S1 – 1.3306
S2 – 1.3184
S3 – 1.3062
R1 – 1.3428
R2 – 1.3550
R3 – 1.3672
The GBP/USD pair remains upward and quickly completed another weak corrective wave. We believe there is no fundamental reason for the pound to rise. This is not sterling strengthening — it is the dollar weakening, and it has been doing so for two months. And the decline is solely due to Donald Trump. Therefore, Trump's actions could just as easily provoke a sharp drop as another rally. If you trade on pure technicals or the "Trump factor," long positions remain relevant with targets at 1.3428 and 1.3455 if the price remains above the moving average. Short positions are still attractive if the price drops below the moving average, with initial targets at 1.3184 and 1.3062.
Linear Regression Channels help determine the current trend. If both channels are aligned, it indicates a strong trend.
Moving Average Line (settings: 20,0, smoothed) defines the short-term trend and guides the trading direction.
Murray Levels act as target levels for movements and corrections.
Volatility Levels (red lines) represent the likely price range for the pair over the next 24 hours based on current volatility readings.
CCI Indicator: If it enters the oversold region (below -250) or overbought region (above +250), it signals an impending trend reversal in the opposite direction.


