See also

 09.05.2025 05:15 AM
The U.S. stock market has overcome uncertainty and is set for growth towards new all-time highs. The price has settled above the indicator lines of the Balance Line and the MACD Line and has completed a week-long consolidation phase, marked on the chart with a gray rectangle.
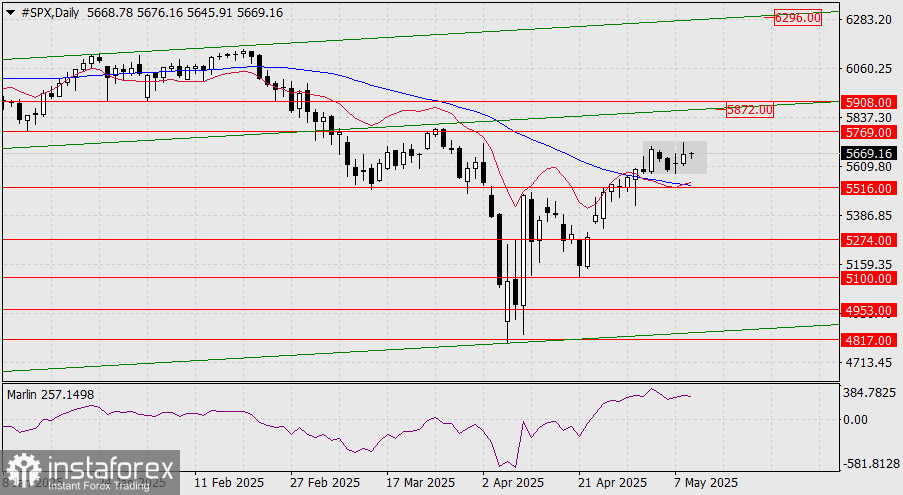
Our target is 6296, the upper boundary of the price channel on the monthly timeframe. However, the first immediate target and resistance level for the S&P 500 quote is 5769, the low from January 13. A breakout above this level will open the path toward a test of two strong resistance levels: 5872 and 5908, the former being an internal price channel line and the latter corresponding to the low of February 3.
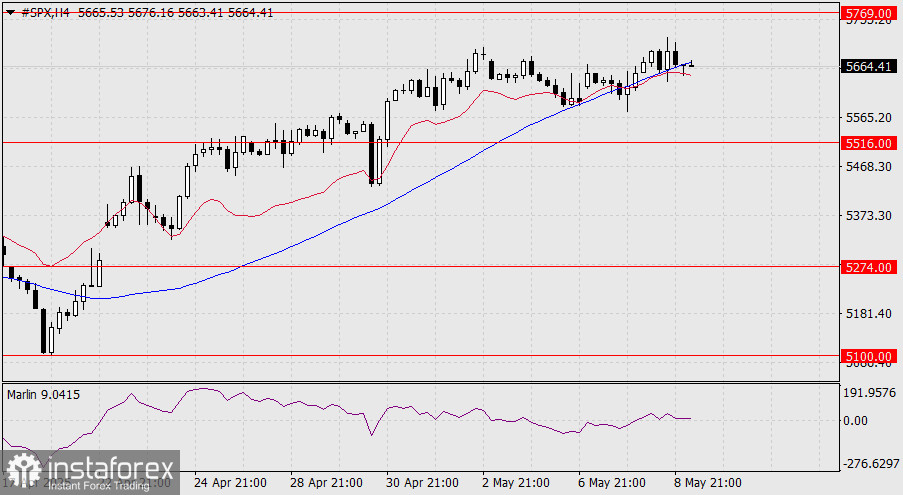
On the four-hour chart, the price is currently testing the MACD Line, while remaining above the Balance Line, which gives it a strong chance to break through this resistance. The signal line of the Marlin oscillator is currently at the neutral zero line, but this development is unfolding within an uptrend zone.
You have already liked this post today
*The market analysis posted here is meant to increase your awareness, but not to give instructions to make a trade.


