See also

 14.05.2025 12:53 PM
On the weekly chart, the price has broken through the resistance of the embedded line of the green price channel and reached the target level of 5,908, the low from February 3. Surpassing this level opens the path towards 6,322.70, the upper boundary of the price channel.
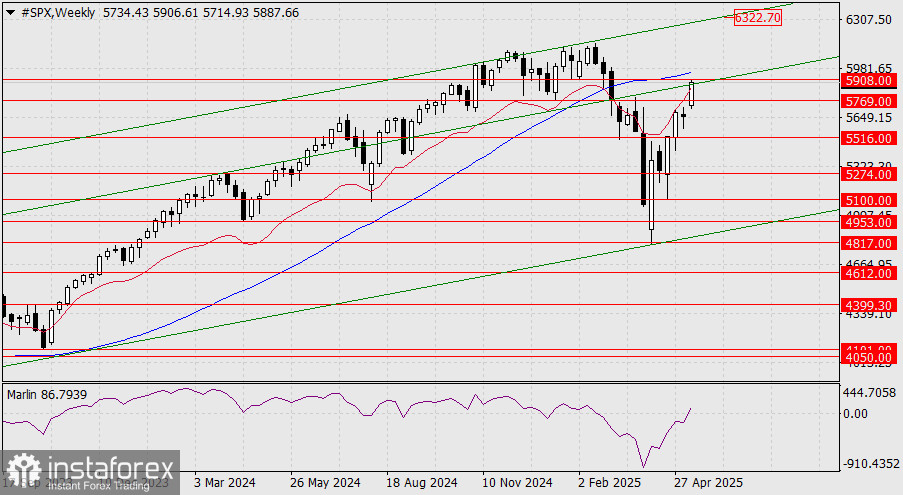
The signal line of the Marlin oscillator has crossed into the territory of an uptrend — an intriguing road lies ahead for the index. The nearest resistance, represented by the Kruzenshtern line at 5,964, serves as an intermediate target for now.
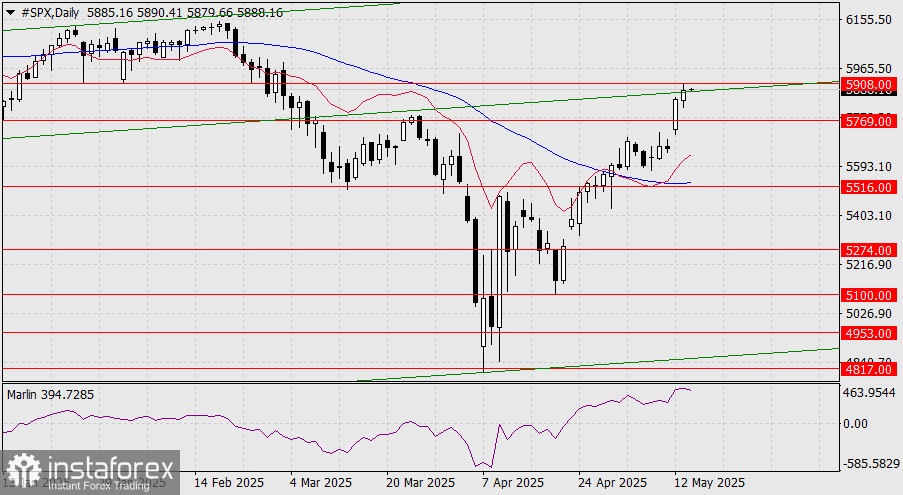
On the daily chart, the price opened today's session above the price channel line — a sign of further attempts to break above the 5,908 level and consolidate beyond it. The Marlin oscillator has slightly weakened in its ascent, suggesting a possible brief consolidation below resistance (1–2 days). However, if the price consolidates above this level, the upward momentum is likely to resume with renewed strength.
You have already liked this post today
*The market analysis posted here is meant to increase your awareness, but not to give instructions to make a trade.


