See also

 16.05.2025 03:54 AM
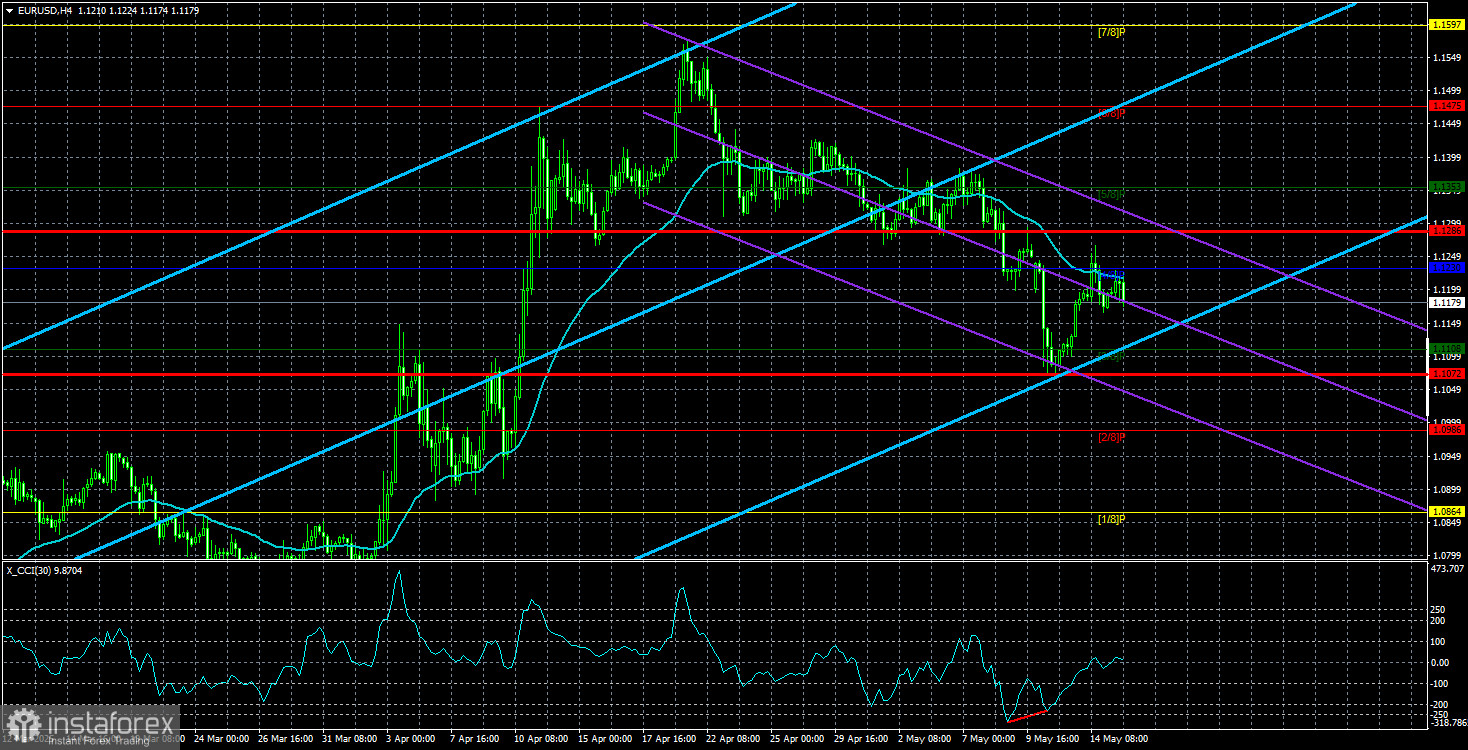
The EUR/USD currency pair moved in both directions on Thursday but ultimately remained below the moving average line. Its position beneath the moving average allows us to expect further strengthening of the U.S. dollar. As noted in previous articles, the fundamental background supports dollar appreciation, but there's one crucial nuance. The fundamental backdrop tied to global trade tensions supports the dollar. All other fundamental factors have been backing it for months already.
It's important to note that the most important monetary policy factor between the European Central Bank and the Federal Reserve still favors the dollar. The ECB has cut its key interest rate seven times in a row and is prepared to continue easing even below the "neutral" level. On the other hand, the Fed has not implemented a single rate cut in 2025 and has only cut three times in 2024, despite market expectations of 6–7 cuts last year and four this year. Once again, market expectations are significantly diverging from reality—a strong supportive factor for the dollar, which the market is currently ignoring.
Let's return to the current narrative that the market is focused on. The 90-day reduction in tariffs for 74 countries, the trade deal with the UK, and the tariff cut for China (and reciprocally) down to a modest 30–10% all point to de-escalation in the trade war. Sure, the end of the conflict is still a long way off—but did anyone expect it to be resolved in a single day? Every significant change begins with small steps. If the dollar kept falling on every new tariff headline for two months, why shouldn't it rise now on every report of eased tensions?
Thus, we fully support the current strengthening of the U.S. dollar. It's also worth noting that the U.S. dollar remains firmly in the lead in the long run. It has been rising for 16 years. This trend may be over, but if the economy grows under Donald Trump as he forecasts, that will be another compelling reason for significant dollar strength. Wouldn't you agree? Therefore, despite the dollar's decline over the last three months and even though a weaker dollar benefits Trump, we don't believe the American currency will keep falling for years to come.
Of course, with Trump, anything is possible. No one knows what shocks await the world in the next four years or how global markets will be forced to respond. However, we believe the dollar has decent prospects for recovery. And if the market remembers other fundamental and macroeconomic factors, the dollar could return to the 1.03–1.04 area.
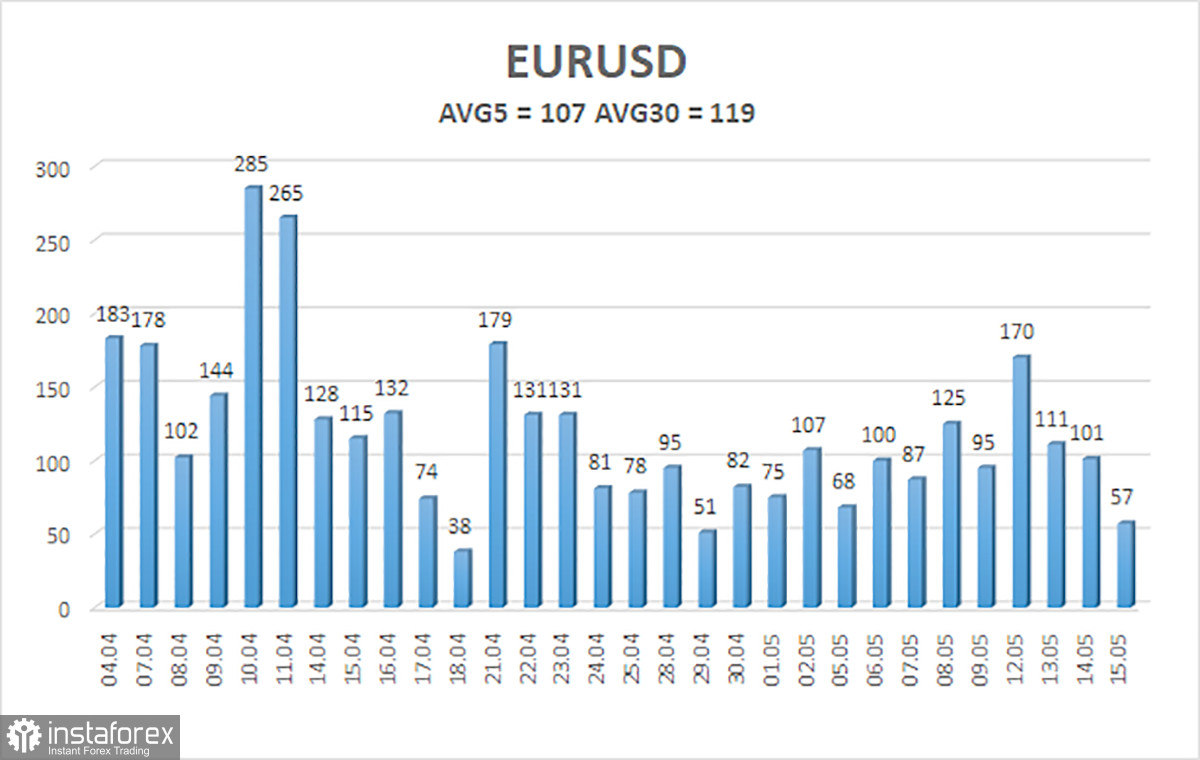
The average volatility of the EUR/USD pair over the past five trading days as of May 16 is 107 pips, which is considered high. We expect movement between the levels of 1.1072 and 1.1286 on Friday. The long-term regression channel remains upward-sloping, pointing to a short-term uptrend. The CCI indicator recently dipped into oversold territory, which in an uptrend usually signals a resumption of growth, although the trade war again introduced adjustments. A bullish divergence formed a bit later, triggering a new upward move.
S1 – 1.1108
S2 – 1.0986
S3 – 1.0864
R1 – 1.1230
R2 – 1.1353
R3 – 1.1475
The EUR/USD pair continues a downward correction within an upward trend. Over the past few months, we've repeatedly stated that we expect only declines from the euro in the medium term, and nothing has changed in that view. The dollar still has no fundamental reason to weaken, except Donald Trump. However, Trump is now focused on trade peace. As a result, the trade war factor is currently supporting the U.S. dollar, which could return to its initial positions around 1.03. Long positions are not considered relevant under current circumstances. Short positions targeting 1.1108 and 1.1072 remain appropriate if the price is below the moving average.
Linear Regression Channels help determine the current trend. If both channels are aligned, it indicates a strong trend.
Moving Average Line (settings: 20,0, smoothed) defines the short-term trend and guides the trading direction.
Murray Levels act as target levels for movements and corrections.
Volatility Levels (red lines) represent the likely price range for the pair over the next 24 hours based on current volatility readings.
CCI Indicator: If it enters the oversold region (below -250) or overbought region (above +250), it signals an impending trend reversal in the opposite direction.


