See also

 21.05.2025 07:46 AM
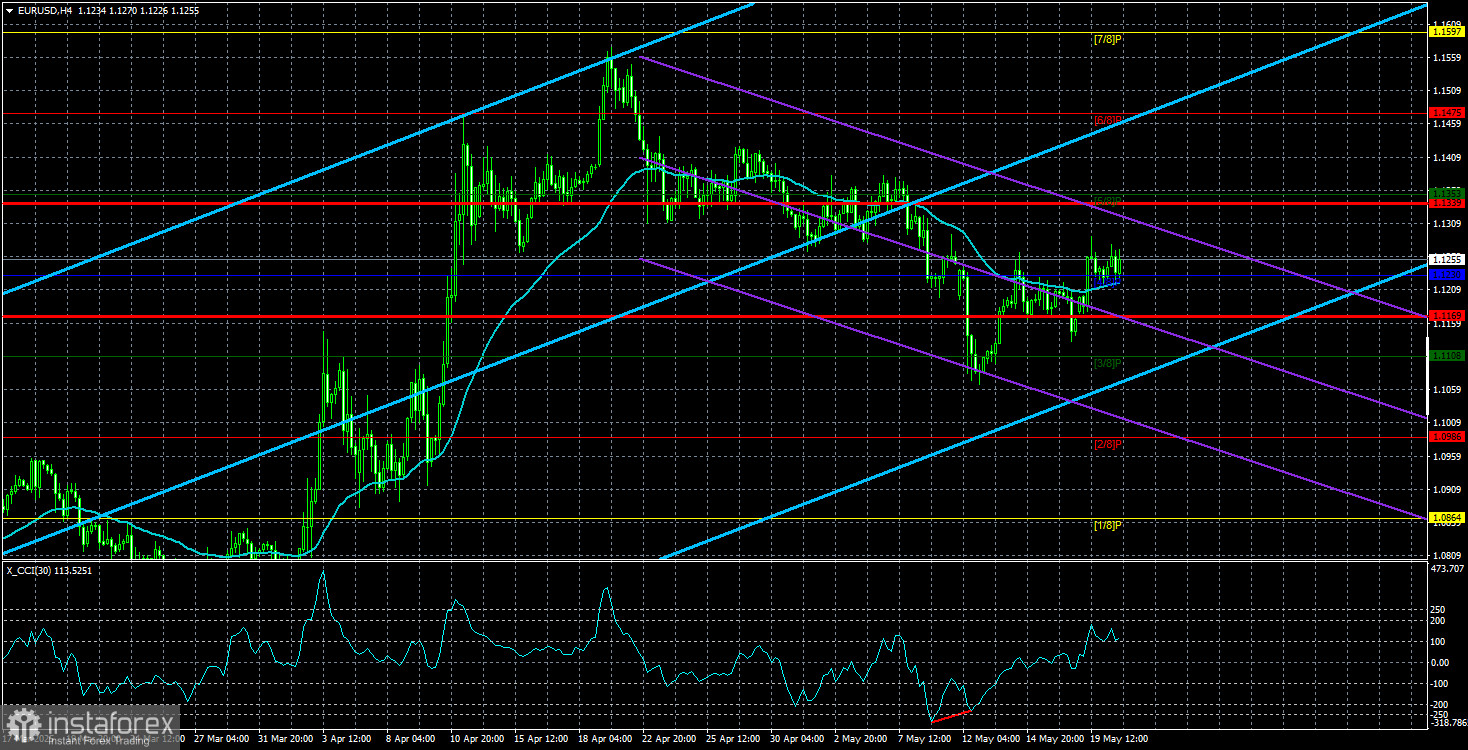
The EUR/USD currency pair moved sluggishly on Tuesday, which was not surprising given the absence of news. Monday didn't bring much in the way of important news either, yet the market latched onto the downgrade of the U.S. credit rating and noted the Federal Reserve's increased purchases of government bonds. However, in our opinion, the dollar's decline on Monday may have occurred even without a formal reason.
The market is consistently looking for excuses to sell the dollar, yet such reasons are not found daily. Yes, the U.S. economy will undoubtedly suffer from Donald Trump's actions, and his vision of a bright future is far from guaranteed. But how much longer will the dollar keep falling based on a factor that hasn't fully materialized yet? For two years, the market has been selling the dollar in anticipation of monetary easing by the Fed, but that easing still hasn't happened. Who pays the price for these misguided expectations? Even trying to follow the market's recent logic makes it hard to explain the movements we've been seeing.
The market continues to be driven more by emotion than logic, mainly reacting to internal sentiment. Despite growing economic problems in the U.S. and the looming threat of a recession, U.S. stock indices are rising steadily and approaching record highs. And as for Bitcoin—well, that defies explanation altogether. We analyze it daily, and who can explain why Bitcoin has gained $30,000 in a month? Are we again blaming it on a "rise in risk appetite"? That can be used to explain anything.
Four months ago, there was at least a clear fundamental foundation that could be used to build a trading strategy. Even if flawed, it offered structure. Now we observe that the European Central Bank has cut rates seven times and is preparing for an eighth, yet the euro isn't falling. The ECB might push the rate below neutral, while the Fed hasn't even hinted when it might resume easing—yet the dollar is plunging and the euro is climbing.
The market focuses solely on the "Trump factor," which makes any fundamental analysis one-sided. That means certain factors must be ignored, while others are exaggerated. From this standpoint, the dollar could easily resume its decline, and no one would be surprised. Everyone would say "because of Trump," and that explanation would suffice. If the dollar starts recovering, no one will be surprised either—after all, the trade war is de-escalating, so it all makes sense. Under Trump, the chaos and absurdity in the markets have multiplied.
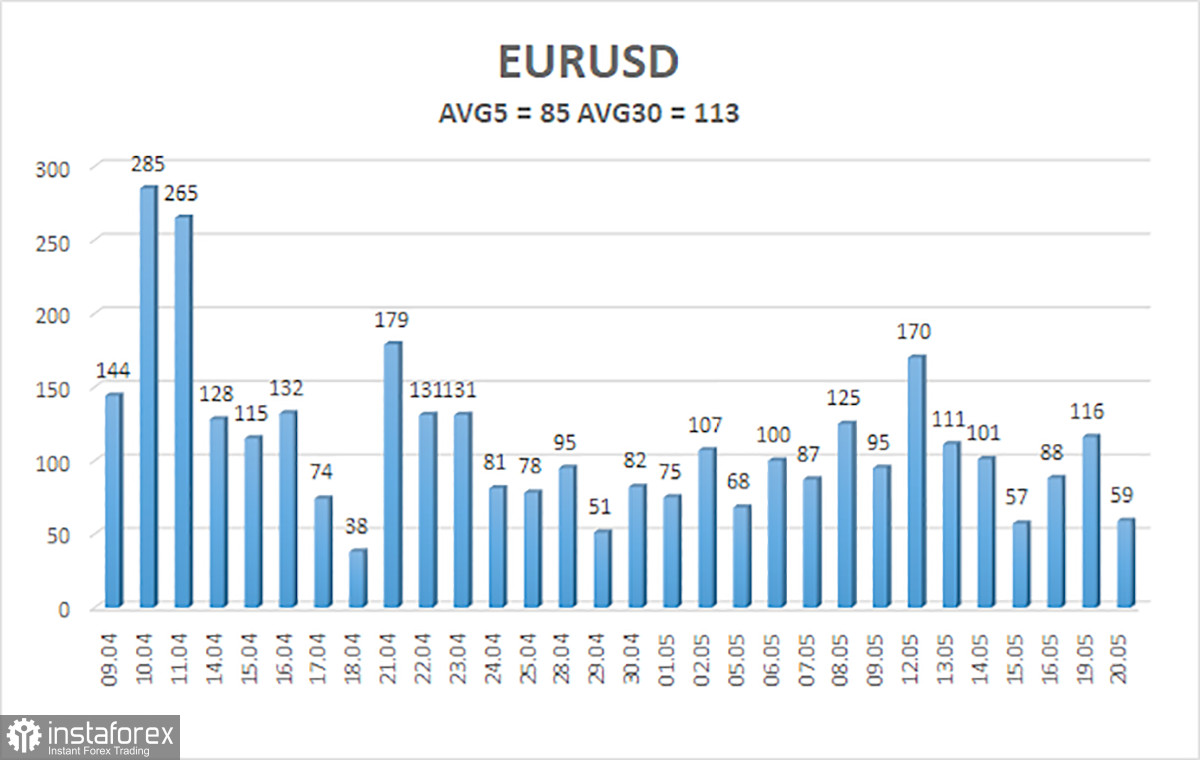
The average volatility of the EUR/USD pair over the last five trading days as of May 21 is 85 pips, which is considered "average." We expect the pair to move between 1.1169 and 1.1339 on Wednesday. The long-term regression channel points upward, indicating a short-term uptrend. The CCI indicator dipped into oversold territory, which signals a trend continuation in an uptrend. A bit later, a bullish divergence formed, triggering a fresh upward wave.
S1 – 1.1230
S2 – 1.1108
S3 – 1.0986
R1 – 1.1353
R2 – 1.1475
R3 – 1.1597
EUR/USD is attempting to resume an uptrend. For several months, we have consistently maintained our expectation of a decline in the euro, which still stands. The dollar fundamentally has no reason to fall, except for Trump's policies. However, since Trump now aims for a trade truce, the trade war factor supports the dollar, which could return to its starting position around 1.03 in the longer term. Under current conditions, we do not consider long positions appropriate. If the price is below the moving average, short positions targeting 1.1169 and 1.1108 remain relevant.
Linear Regression Channels help determine the current trend. If both channels are aligned, it indicates a strong trend.
Moving Average Line (settings: 20,0, smoothed) defines the short-term trend and guides the trading direction.
Murray Levels act as target levels for movements and corrections.
Volatility Levels (red lines) represent the likely price range for the pair over the next 24 hours based on current volatility readings.
CCI Indicator: If it enters the oversold region (below -250) or overbought region (above +250), it signals an impending trend reversal in the opposite direction.


