See also

 28.05.2025 05:08 AM
The U.S. stock index, the S&P 500, has completed the correction that began on May 20. A sign of its completion is the price breakout above the inner boundary of the green price channel and the target level of 5908 (the low from February 3).
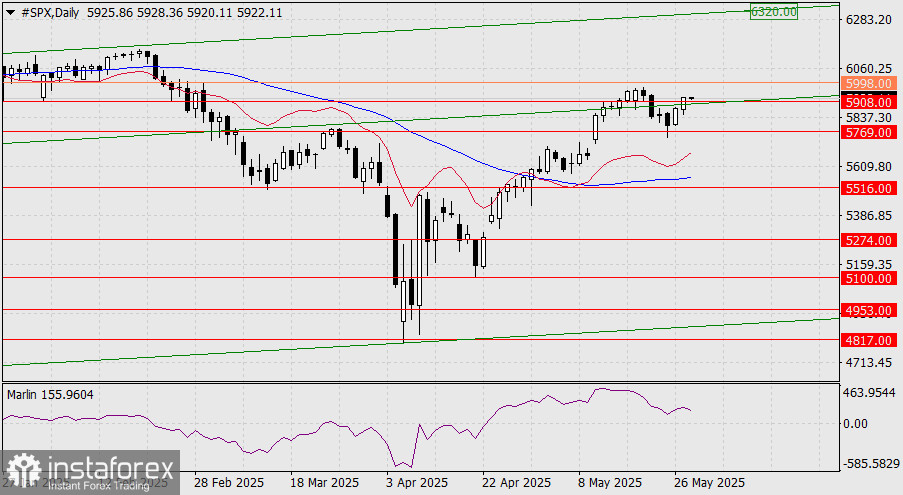
Once the price breaks above the intermediate resistance level of 5998 (the February 12 low), the upward move toward the upper boundary of the price channel, around the 6320 mark, is expected to accelerate.
Alternative Scenario: If the price consolidates below 5908, a renewed downward corrective leg toward the 5769 support area is possible.
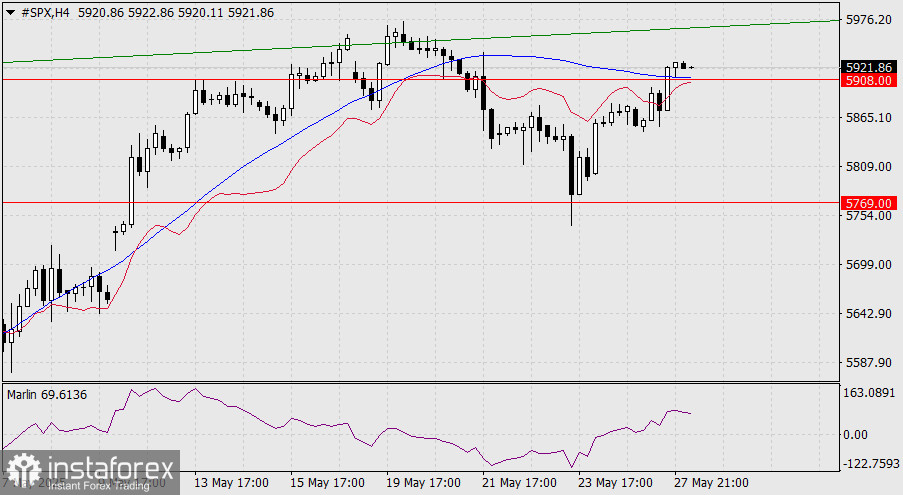
On the four-hour chart, the price has secured a breakout above 5908 and the MACD line. The Marlin oscillator is rising ahead of the price, signaling bullish momentum. This chart setup confirms the bullish scenario as the primary one.
You have already liked this post today
*The market analysis posted here is meant to increase your awareness, but not to give instructions to make a trade.


