See also

 29.05.2025 03:32 AM
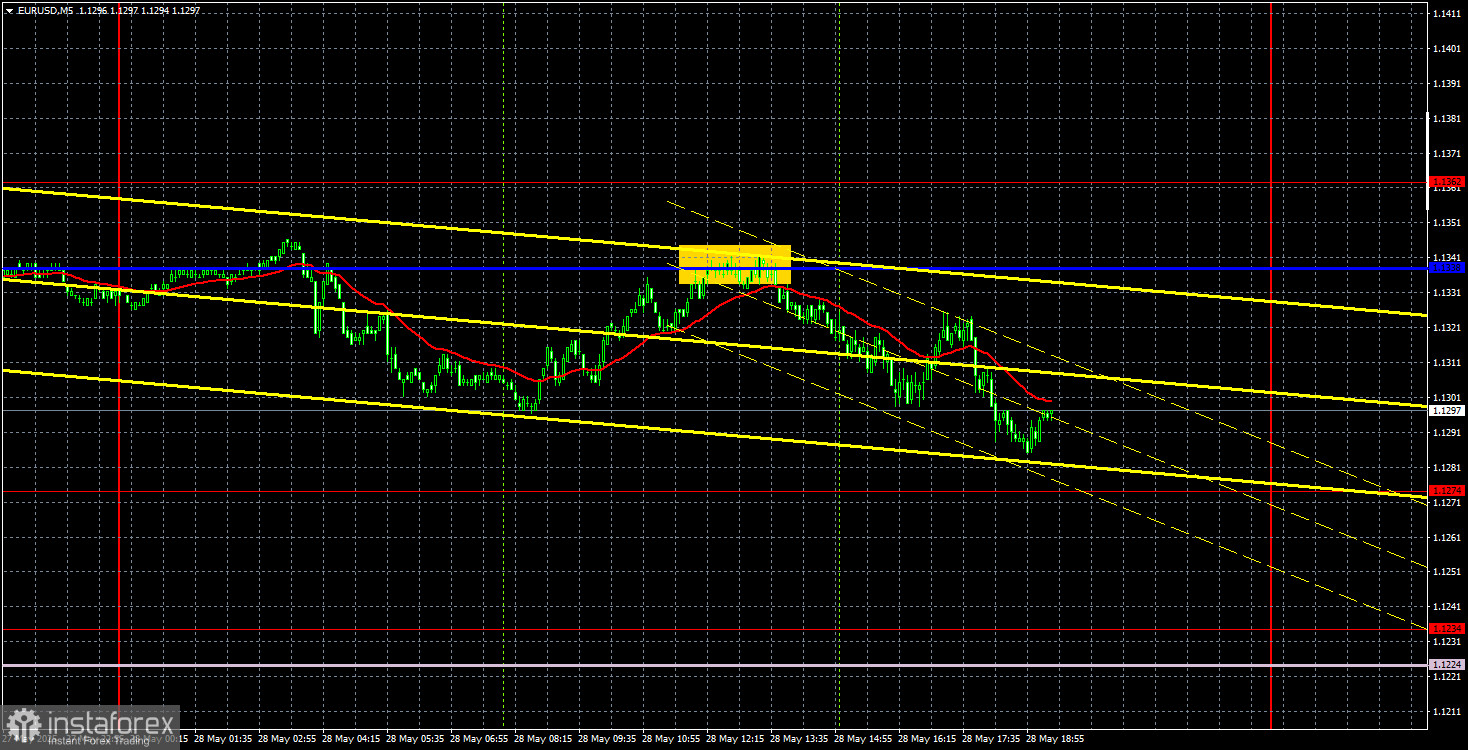
On Wednesday, the EUR/USD currency pair continued a mild downward movement, which still falls within the framework of the prevailing uptrend. In other words, we are still observing a correction. The U.S. dollar had little justification for further growth yesterday, but the downward movement continued due to inertia. It's worth noting that just below the current price lies an important support level at 1.1274, along with an ascending trendline. It seems probable that the price is targeting these specific technical levels. Given the current fundamental and macroeconomic background, we see no compelling reasons for these levels to be broken.
Of course, that doesn't mean such a breakout is impossible. Market movements cannot be predicted with complete certainty. But what possible reasons are there now for a stronger dollar? Trump's postponement of tariff hikes for the EU until July 9? A slightly less disastrous U.S. durable goods orders report than expected? Today's second estimate of Q1 GDP will also be published, but it is unlikely to cheer traders with a positive reading.
Therefore, we expect either a flat market or a resumption of the uptrend. In recent months, the market has shown it can sell off the dollar even without immediate macroeconomic or fundamental reasons. On the 5-minute timeframe on Wednesday, only one trading signal was generated. During the European session, the price rebounded from the critical line and nearly dropped to the target level of 1.1274. By the evening, it was quite reasonable to manually close short positions, as the probability of the decline ending was high.
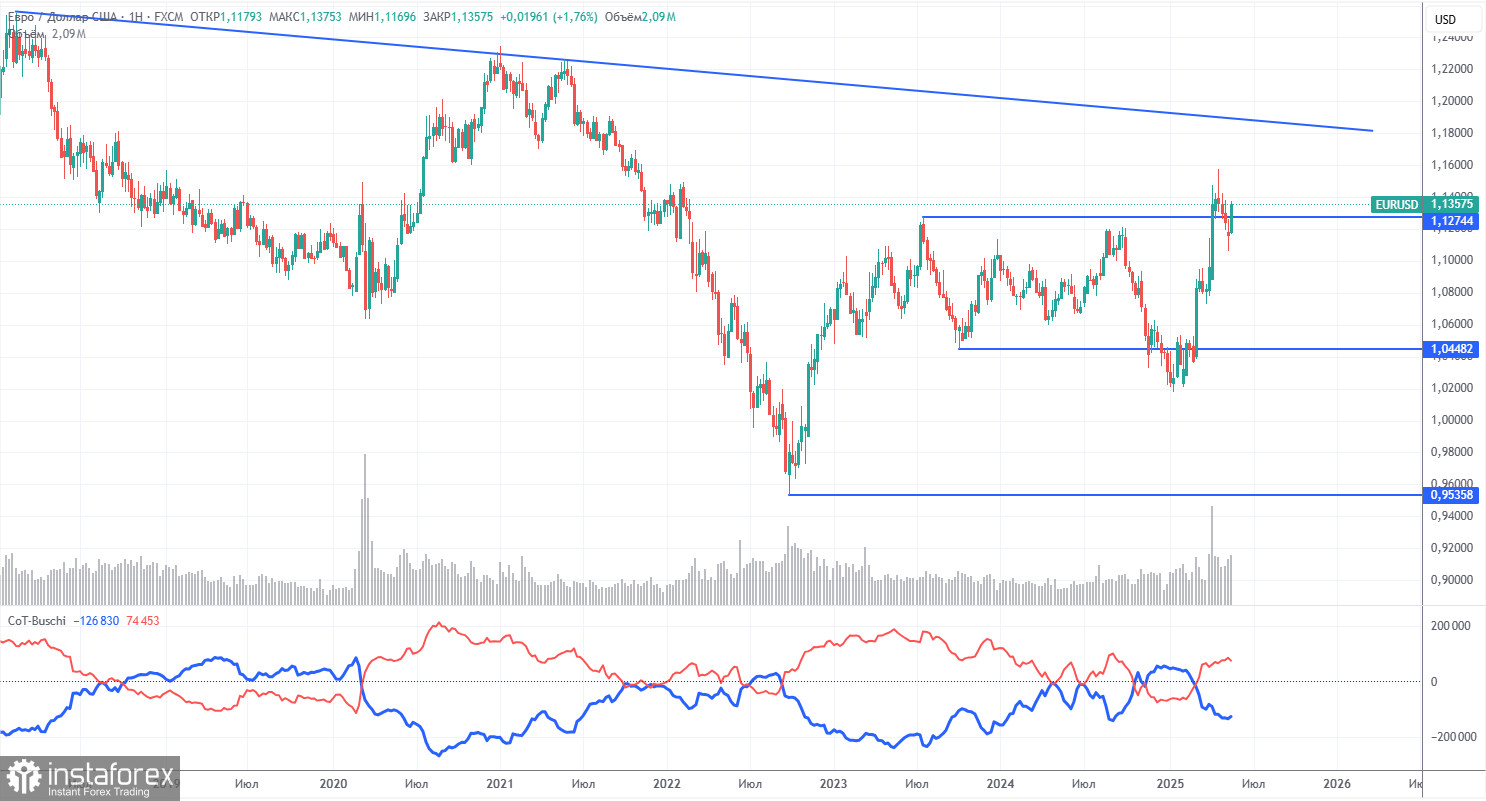
The latest COT report is dated May 20. The chart above clearly shows that the net position of non-commercial traders remained bullish for a long time. Bears barely gained dominance at the end of 2024 but quickly lost it. Since Trump took office, the dollar's value has been declining significantly. We cannot confidently say with 100% certainty that the dollar's decline will continue, but current global developments suggest that outcome.
No fundamental factors support the euro's strength; however, one significant factor contributes to the dollar's weakness. The long-term downtrend persists, though what does the trend even mean right now? The dollar could rise again once Trump ends his trade wars, but will he?
The red and blue lines have crossed again, indicating a renewed bullish sentiment in the market. During the latest reporting week, the number of long positions among "Non-commercial" traders decreased by 3,500, while short positions increased by 6,800. As a result, the net position fell by 10,300. However, the COT reports are released with a one-week delay. The market is once again actively buying now.
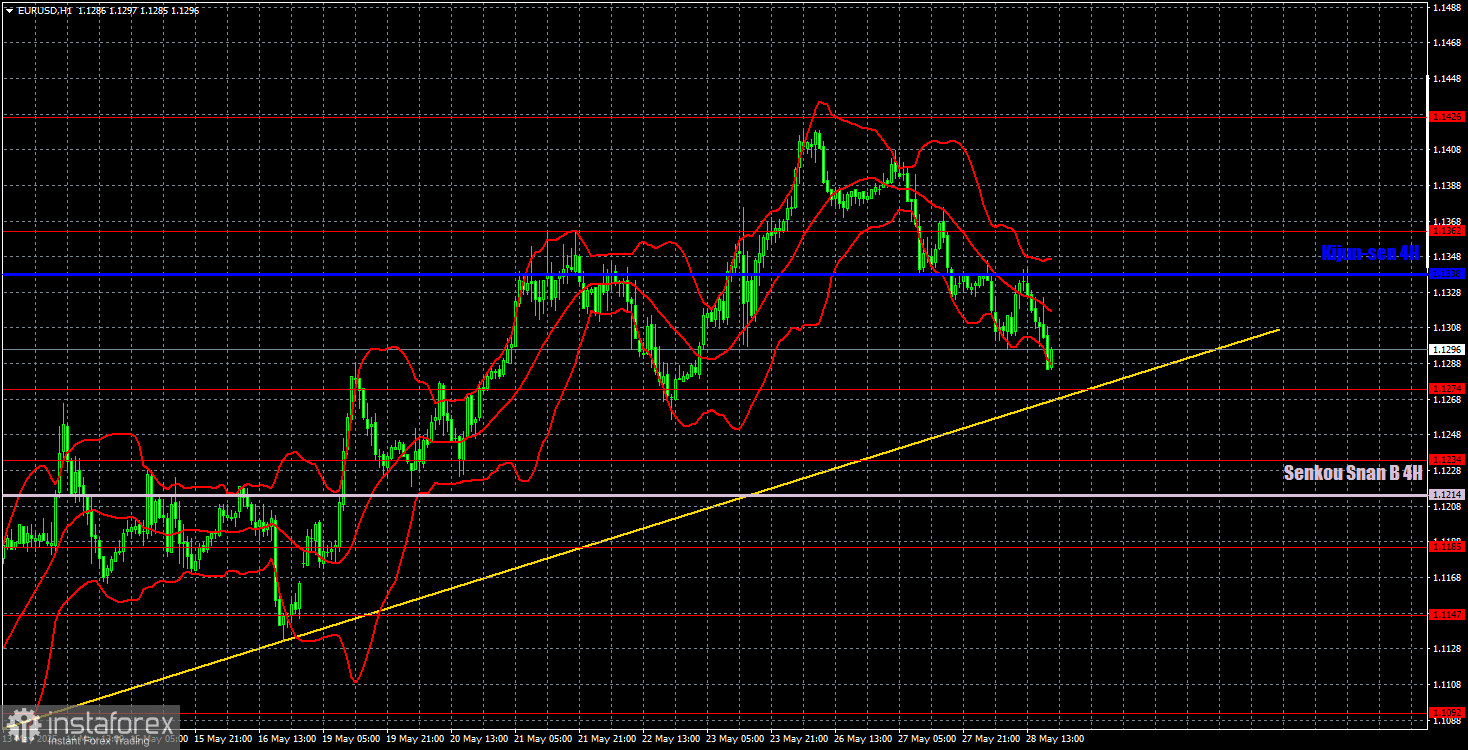
On the hourly timeframe, the EUR/USD pair retains a local uptrend that has been part of a four-month bullish trend. The future of the U.S. dollar continues to hinge on developments related to the global trade war. If trade agreements are signed and tariffs lowered, the dollar may begin to recover. However, as things stand, no such agreements exist. Trump continues to make odd decisions and shocking statements, leaving market participants bracing for the worst and essentially losing trust in him. The price must consolidate below the trendline for the upward trend to be considered broken.
For May 29, the following trading levels are highlighted: 1.0823, 1.0886, 1.0949, 1.1006, 1.1092, 1.1147, 1.1185, 1.1234, 1.1274, 1.1362, 1.1426, 1.1534, and 1.1607, as well as the Senkou Span B line at 1.1214 and the Kijun-sen line at 1.1338. Note that the Ichimoku indicator lines can shift throughout the day, so this must be considered when identifying trading signals. Don't forget to set a Stop Loss to break even if the price moves 15 pips in the right direction—this protects against potential losses if the signal turns out to be false.
No significant events are scheduled in the Eurozone for Thursday, while in the U.S., the second estimate of Q1 GDP will be released. The second estimate is generally considered the least impactful, so we do not expect any strong market reaction, especially considering traders ignored the first estimate.


