See also

 29.05.2025 03:32 AM
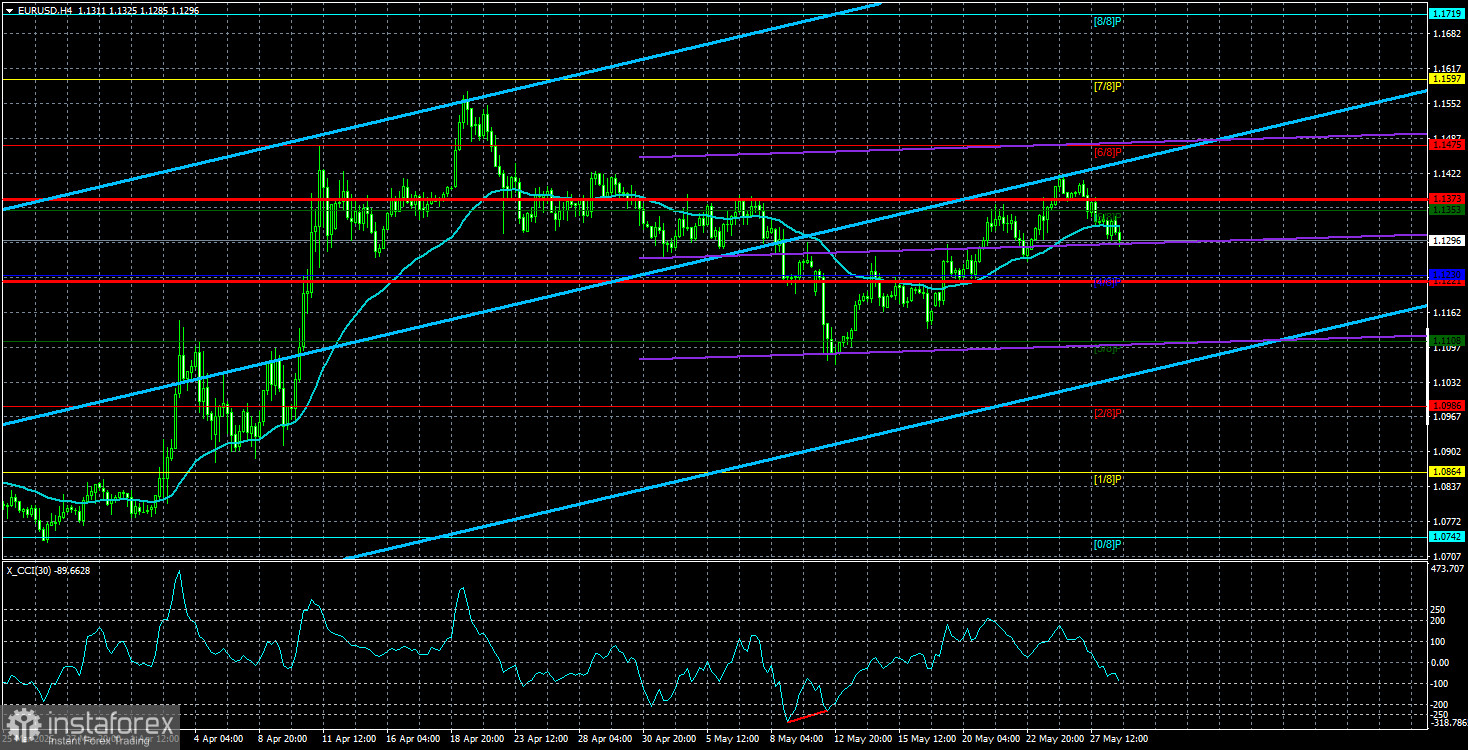
The EUR/USD currency pair did not perform as well for the dollar on Wednesday as it did during the previous two days. However, even Monday and Tuesday can hardly be described as strong days for the U.S. dollar. What did we learn on Monday? After a discussion with Ursula von der Leyen, Donald Trump decided to postpone the immediate implementation of the proposed 50% tariff hike. What did we learn on Tuesday? Durable goods orders in the U.S. dropped by 6.3%. Now, let's look at this data objectively. What's positive about it? That the trade conflict between the U.S. and the EU didn't escalate further? That order volume did not fall by 7.8% as expected, but by "only" 6.3%? From our perspective, the reasons for optimism seem quite questionable.
But Donald Trump wasn't done. On Wednesday, he claimed that the European Union requested urgent scheduling of meetings with U.S. representatives to discuss a trade deal. Trump said the parties might agree on a deal before July 9. Sometimes, it feels as though Trump is using NLP techniques, repeating similar statements over and over to mentally steer the public in his direction. There are no signs of active trade talks or updates on progress—neither with the EU nor China. Perhaps negotiations with Brussels will begin soon, but who says they will conclude by July 9 and end with a signed agreement?
It's worth recalling that during Trump's first term, negotiations with China lasted more than a year and a half. The UK negotiated with the EU for several years. On what basis can one expect a U.S.–EU or U.S.–China deal within a few weeks? As usual, there was a lot of talk and very little action. One must remember that, as of now, the U.S. has signed only one trade deal— with the UK. And even at the time of its announcement, the agreement had not yet been signed, and the parties were expected to discuss many details for weeks to come.
Thus, we believe the dollar has already responded to the market's short-term optimism, but no further reasons exist for sustained strengthening. Traders continue to ignore genuinely important factors that could benefit the dollar—if only Trump hadn't started the trade war. For now, however, the market is only focused on developments in the trade conflict. The positive news has been priced in. What's next?
In the near term, we could reasonably expect the dollar's decline to resume—or at least for its rise to stall. Technical indicators must confirm any trading assumption, so long positions should only be considered if the price is above the moving average.
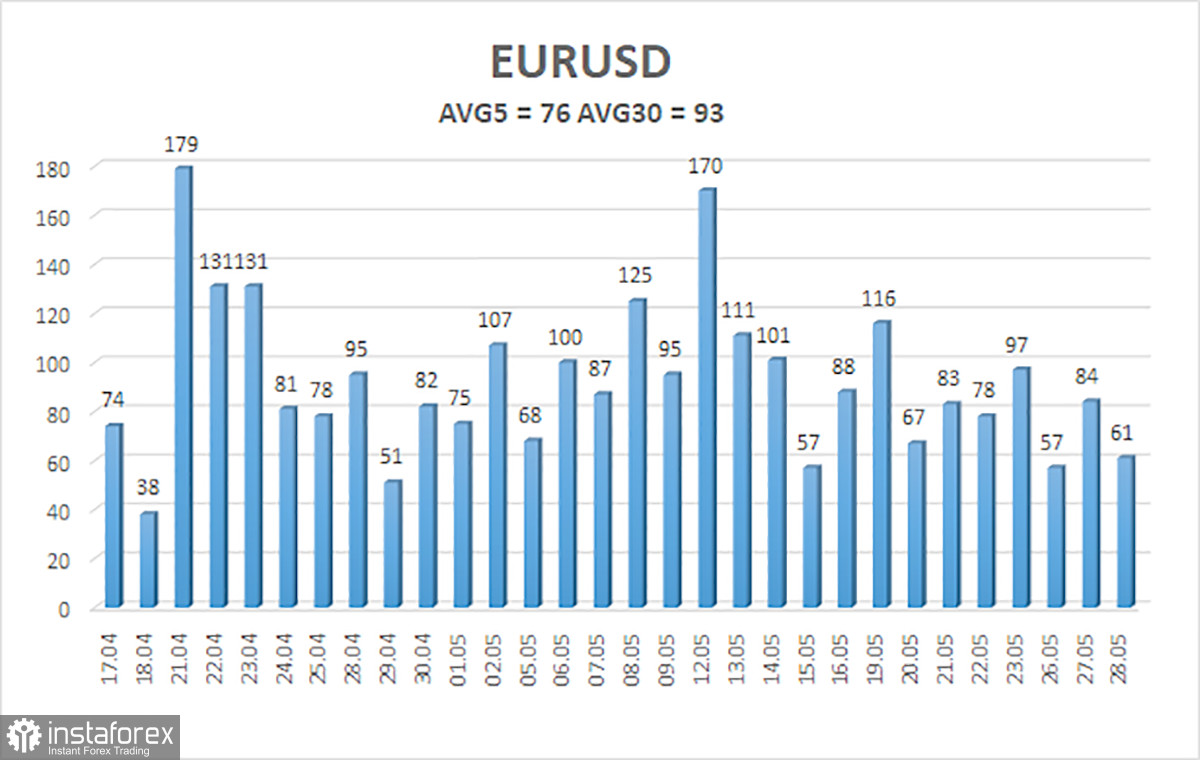
The average volatility of the EUR/USD pair over the last five trading days as of May 29 is 76 pips, which is classified as "moderate." We expect the pair to move within the range of 1.1221 to 1.1373 on Thursday. The long-term regression channel remains upward-sloping, continuing to indicate an uptrend. The CCI indicator recently entered oversold territory, and a bullish divergence has also formed, signaling the potential for the trend to resume.
S1 – 1.1230
S2 – 1.1108
S3 – 1.0986
R1 – 1.1353
R2 – 1.1475
R3 – 1.1597
The EUR/USD pair is attempting to resume its upward trend. For months, we've repeatedly said that we expect only a medium-term decline from the euro because the U.S. dollar fundamentally has no reason to fall—apart from Donald Trump's policy decisions, which will likely have devastating effects on the American economy. Nonetheless, the market still shows a complete unwillingness to buy the dollar, even when there are reasons to do so. Short positions remain relevant when the price is below the moving average, with targets at 1.1230 and 1.1108, although a strong dollar rally should not be expected. Above the moving average, long positions should be considered with targets at 1.1475 and 1.1597.
Linear Regression Channels help determine the current trend. If both channels are aligned, it indicates a strong trend.
Moving Average Line (settings: 20,0, smoothed) defines the short-term trend and guides the trading direction.
Murray Levels act as target levels for movements and corrections.
Volatility Levels (red lines) represent the likely price range for the pair over the next 24 hours based on current volatility readings.
CCI Indicator: If it enters the oversold region (below -250) or overbought region (above +250), it signals an impending trend reversal in the opposite direction.


