See also

 02.06.2025 03:55 AM
The EUR/USD currency pair traded calmly on Friday, but this calm will not last long. Last week, particularly on Thursday, another storm erupted in the market, caused by a familiar figure — the U.S. President. However, this time, he wasn't even a direct initiator. The situation in America has increasingly resembled a "sad circus" in recent months. The events unfolding across the ocean could make anyone laugh — if only they didn't affect the entire world and virtually every consumer. The "American farce" looks comical from the outside, but unfortunately, it's no laughing matter.
On Thursday, the U.S. Court of International Trade blocked nearly all tariffs on imports into the U.S. that Donald Trump had introduced in recent months. The court justified its decision by stating that even the Emergency Powers Act does not grant the president the authority to unilaterally impose global tariffs and sanctions — such decisions must be approved by the U.S. Congress. However, Congress under Trump doesn't function properly because he has effectively blocked it. The Trade Court ruled that Trump's actions were illegal and unconstitutional.
Of course, Trump immediately filed an appeal, and by the evening, the Trade Court's decision was suspended. It's that easy — if you're president, you can override any court decision. Thus, all tariffs remain in effect for now, and Trump declared that the Trade Court's ruling would not change anything. If necessary, the administration would take the matter to the Supreme Court, where six of nine justices are Republicans. However, it's unlikely even to reach the Supreme Court — American legislation is structured such that a suitable law can always be found. How can one govern a democratic country like the U.S. single-handedly? It's simple: declare a state of emergency in any sphere that requires decisions without Congress — and voila!
Meanwhile, last week, the market resumed its dollar sell-off. What can traders do when the situation is not improving? How many trade deals has Trump signed? One. One out of 75. Negotiations with China and the EU are currently in an ambiguous phase. There are no signs of de-escalation in the Global Trade War. It's unclear if any deals will ever be signed. The market continues to ignore all factors that could occasionally support the dollar. Therefore, there are no reasons to expect a strong dollar rally. None whatsoever. Naturally, this is the forex market; nothing is ever 100% certain. Thus, it's advised to anticipate the pair's continued growth but avoid blindly opening long positions at any point.
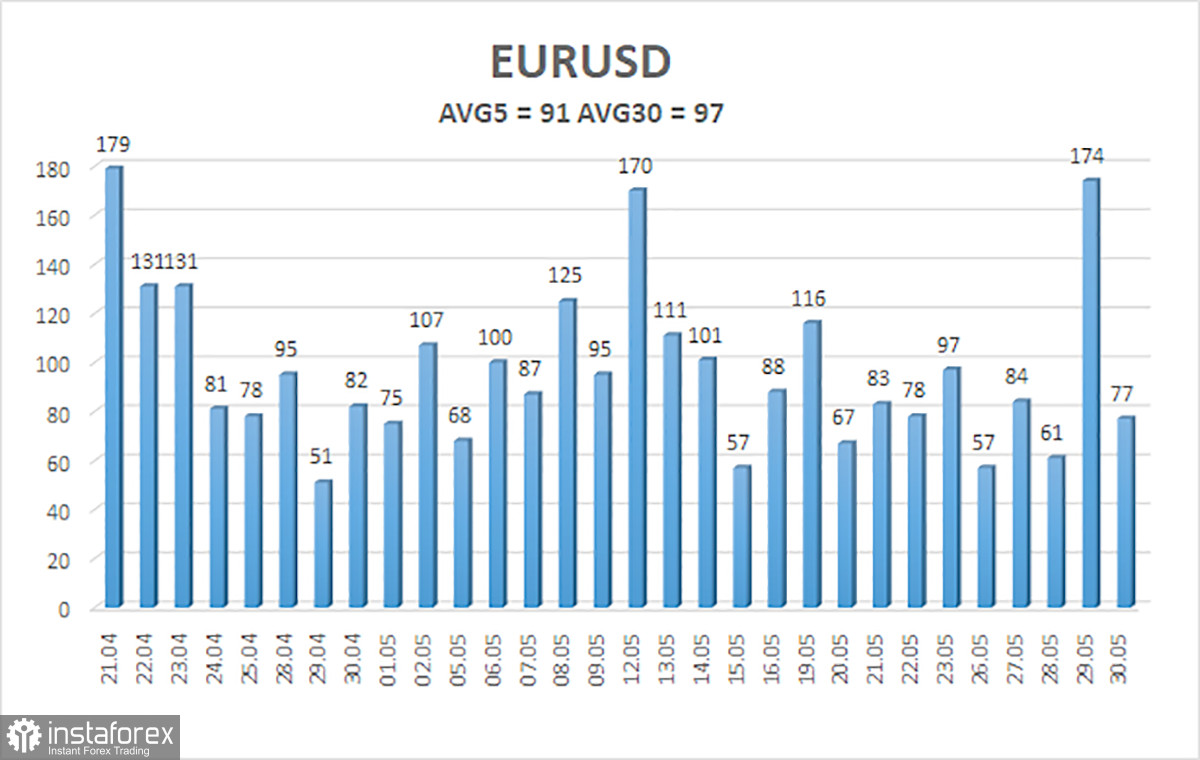
The average volatility of the EUR/USD currency pair over the past five trading days as of June 2 is 91 pips, classified as "average." We expect the pair to move between the levels of 1.1257 and 1.1439 on Monday. The long-term regression channel is directed upwards, still indicating an uptrend. The CCI indicator entered the oversold area and formed a bullish divergence, signaling a trend resumption within the uptrend.
S1 – 1.1230
S2 – 1.1108
S3 – 1.0986
R1 – 1.1353
R2 – 1.1475
R3 – 1.1597
The EUR/USD pair is trying to resume its uptrend. In recent months, we have consistently said that we expect only a decline in the euro in the medium term because there are no reasons for the dollar to fall — except for Trump's policies, which will likely have destructive and long-term consequences for the American economy. However, the market continues to show a complete unwillingness to buy the dollar, even when there are reasons to do so, and completely ignores positive factors for the dollar.
Short positions are relevant if the price is below the moving average, with targets at 1.1257 and 1.1230, but no strong dollar growth should be expected. Above the moving average, long positions can be considered with targets at 1.1439 and 1.1475.
Linear Regression Channels help determine the current trend. If both channels are aligned, it indicates a strong trend.
Moving Average Line (settings: 20,0, smoothed) defines the short-term trend and guides the trading direction.
Murray Levels act as target levels for movements and corrections.
Volatility Levels (red lines) represent the likely price range for the pair over the next 24 hours based on current volatility readings.
CCI Indicator: If it enters the oversold region (below -250) or overbought region (above +250), it signals an impending trend reversal in the opposite direction.


