See also

 04.06.2025 03:41 AM
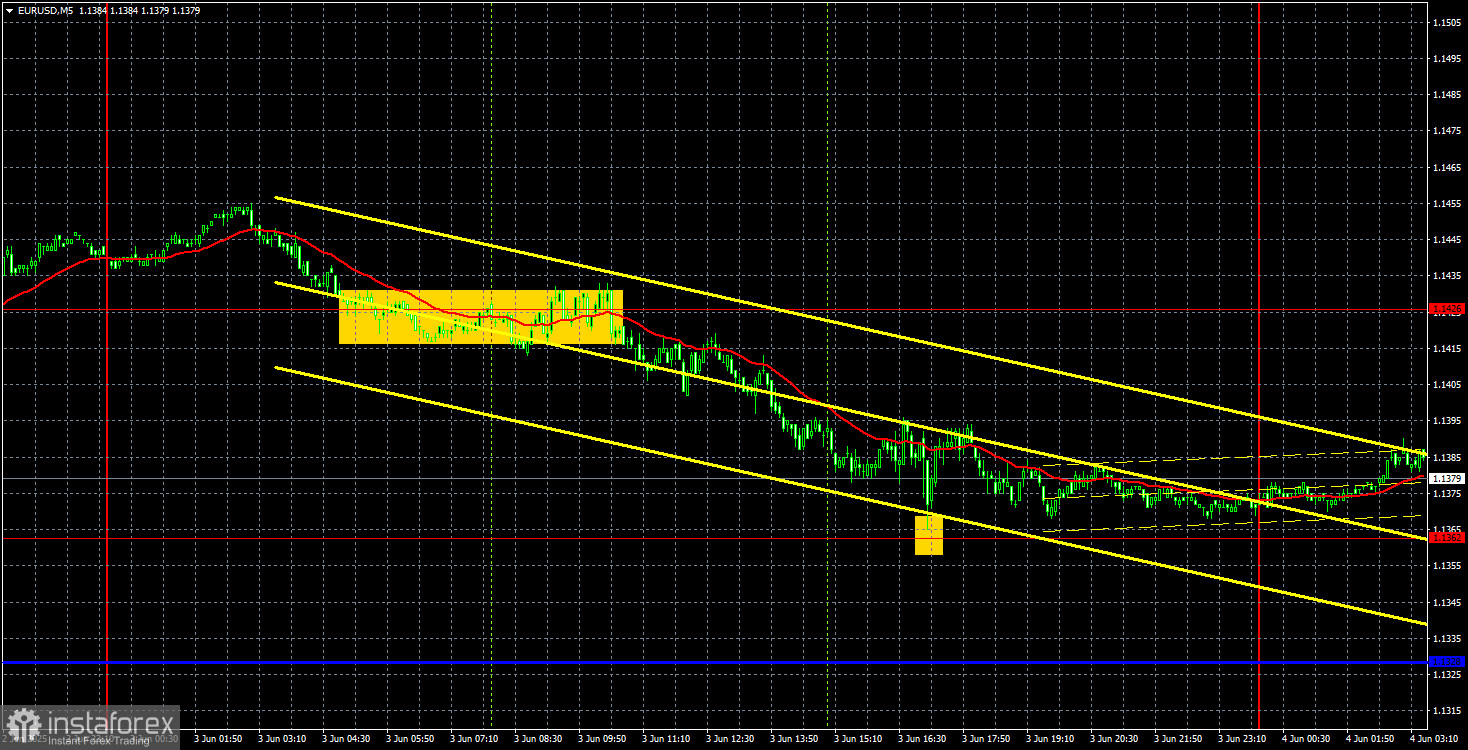
The EUR/USD currency pair started a weak downward movement on Tuesday, likely due to another mild corrective wave. Despite breaking through the trendline, the overall upward trend remains intact because the fundamental background continues to exert regular pressure on the U.S. dollar. The fact that the dollar strengthened yesterday means absolutely nothing. Donald Trump could come out today and announce new tariffs, and the dollar could tumble again.
Yesterday, the main macroeconomic highlights were the EU inflation data and the U.S. JOLTs report. Despite the unexpected outcome of the inflation report, traders showed no interest. The Consumer Price Index slowed to 1.9%, which almost guarantees that the European Central Bank will cut interest rates on Thursday. As for the JOLTs report on job openings, it turned out better than expected and provoked an additional dollar strengthening by a mere 20 pips. As we predicted, Tuesday's macroeconomic data had no real impact on the pair's movement. Several important reports are scheduled for the rest of the week, but it seems that the market will only pay attention to the NonFarm Payrolls and unemployment rate reports on Friday.
On Tuesday, one excellent trading signal and one less successful signal were formed in the 5-minute timeframe. Early in the European session, the price broke above the 1.1426 level and then mainly traded downward for the rest of the day. During the U.S. session, the 1.1362 level was reached with minimal deviation. Therefore, short positions could have been closed there, and long positions opened instead. However, the long positions did not yield profit as the pair only managed to rise about 15 pips, just enough to set a Stop Loss at breakeven.
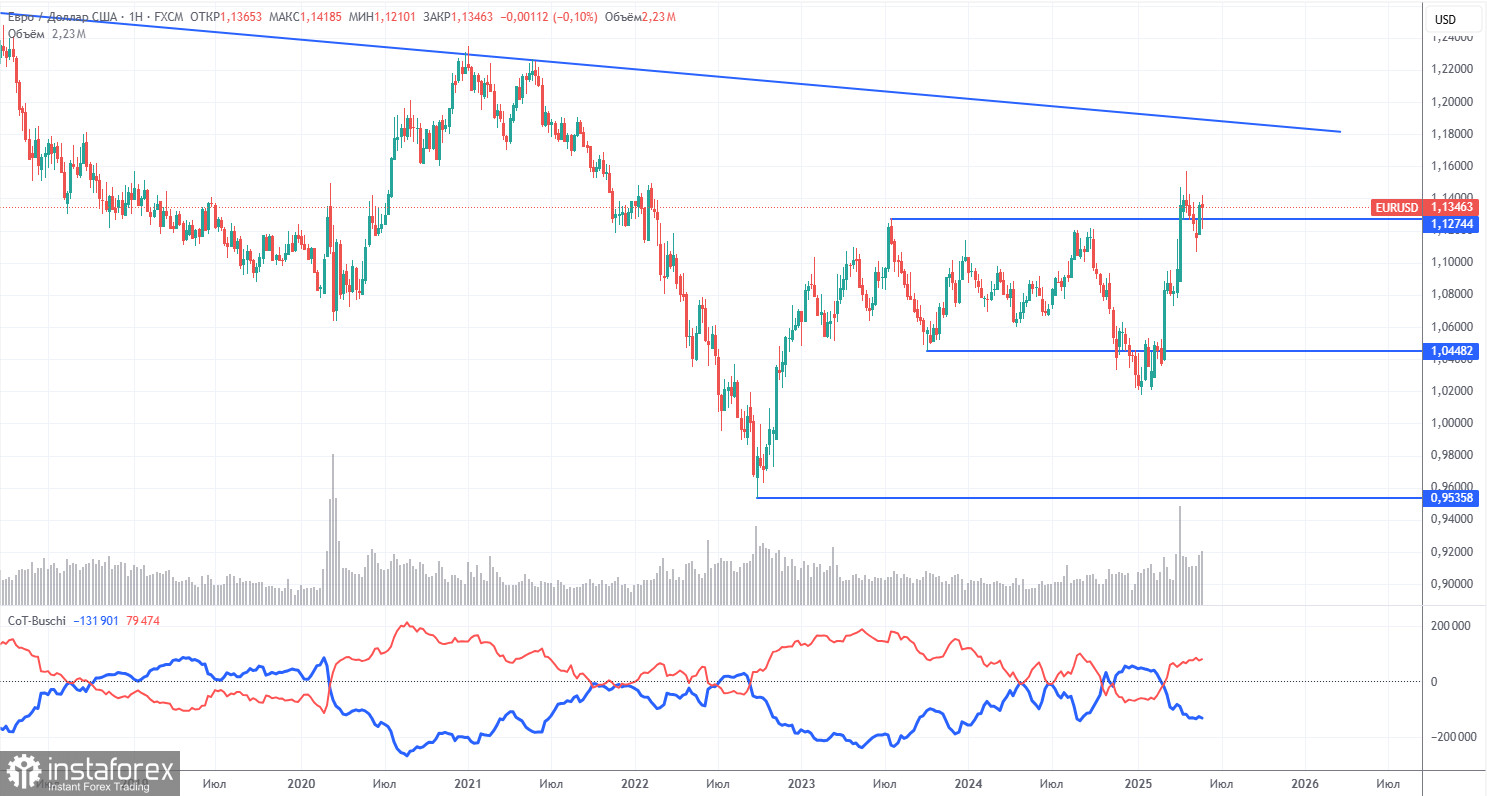
The latest COT report is dated May 27. The chart above shows that the net position of non-commercial traders was bullish for a long time; bears barely gained the upper hand at the end of 2024 but quickly lost it. Since Trump took office as U.S. president, the dollar has rapidly declined in value. We cannot be 100% certain that the dollar's decline will continue, but current global developments point precisely in that direction.
We still do not see any fundamental factors supporting the euro, but one decisive factor remains for the dollar's decline — Trump's trade wars. The global downtrend persists, but what value does a trend have now? The dollar might recover once Trump ends his trade wars — but will he end them? And when?
The red and blue lines have crossed again, so the market trend is again "bullish." Over the last reporting week, the number of long positions in the "Non-commercial" group decreased by 1,700, while shorts decreased by 6,700. Thus, the net position fell by 5,000 over the week. However, COT reports come with a one-week delay. At the moment, the market is actively buying EUR/USD again.
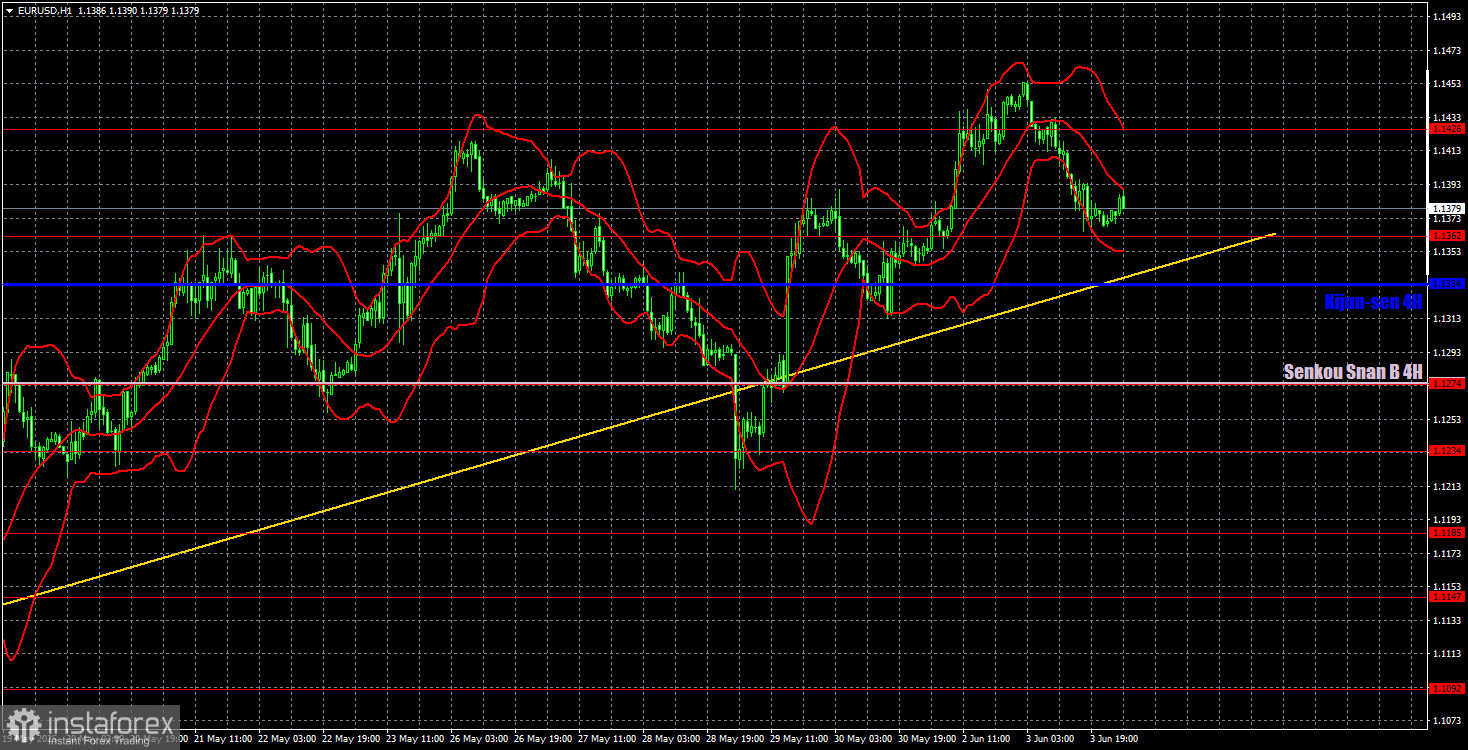
In the hourly timeframe, the EUR/USD pair maintains a local uptrend, part of a 4-month trend. The prospects for the U.S. dollar still depend on developments related to the global trade war. If trade agreements are signed and tariffs are reduced, the dollar may begin to recover. However, no trade deals are currently in place, and Trump continues to make strange decisions and statements that regularly shock market participants. The market expects the worst, and Trump regularly proves it right.
For June 4, we highlight the following trading levels — 1.0823, 1.0886, 1.0949, 1.1006, 1.1092, 1.1147, 1.1185, 1.1234, 1.1274, 1.1362, 1.1426, 1.1534, 1.1607, along with the Senkou Span B line (1.1275) and Kijun-sen (1.1334). The Ichimoku indicator lines may shift during the day, so this should be considered when determining trading signals. Do not forget to set a Stop Loss at breakeven if the price moves 15 pips in the correct direction. This will protect against potential losses if the signal turns out to be false.
Service sector PMI releases are scheduled for Wednesday in Germany, the Eurozone, and the U.S. As on Monday, the most important will be the ISM Services Index, but even that might not trigger a significant market reaction.


