See also

 04.06.2025 07:27 AM
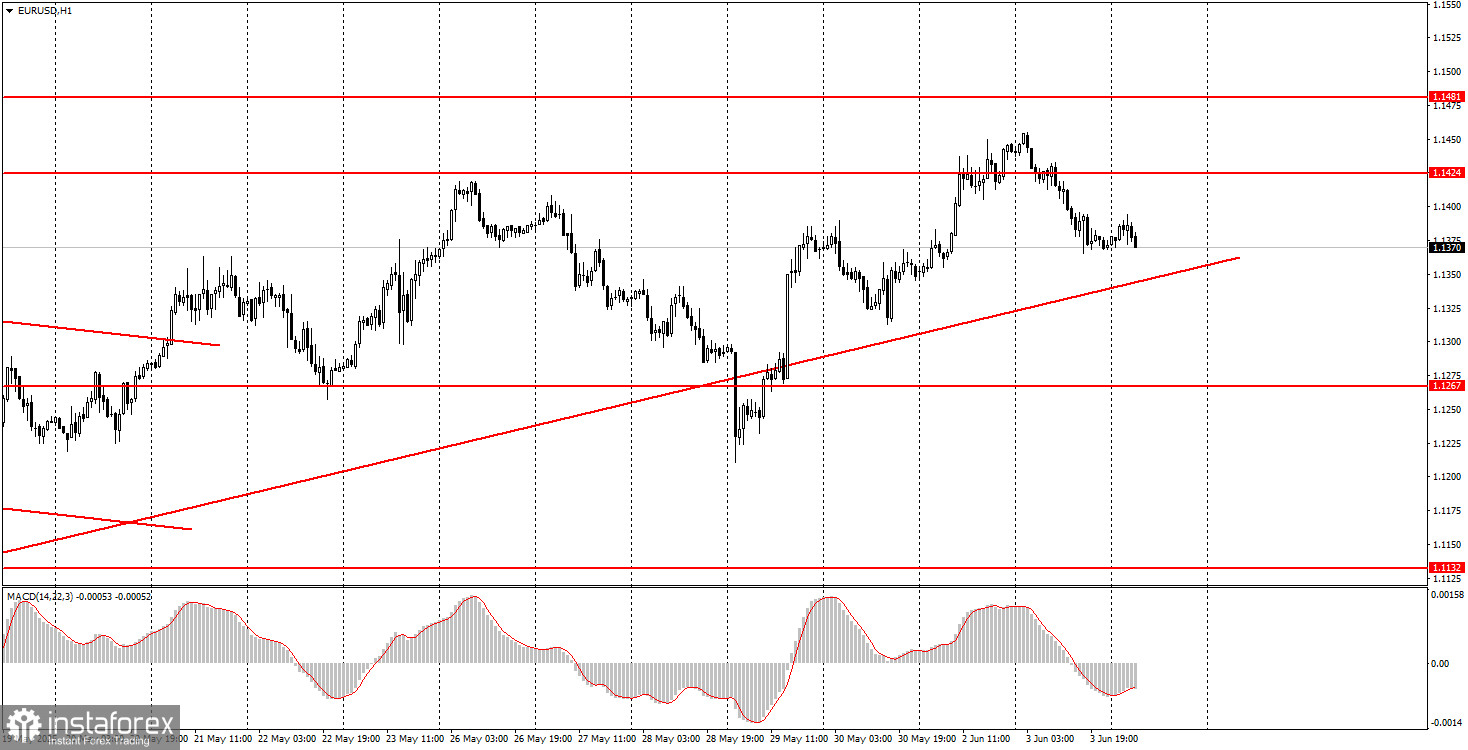
On Tuesday, the EUR/USD currency pair continued to trade lower. If desired, the rise of the U.S. dollar by "only" 50 pips can easily be explained. The inflation rate in the Eurozone dropped below 1.9% year-on-year, which practically gives a 100% guarantee of an ECB rate cut tomorrow. Additionally, the JOLTs report on job openings in the U.S. showed a higher figure than forecasted. Thus, two out of two reports supported the U.S. dollar on Tuesday. However, the market has been overlooking positive macroeconomic news for the dollar for several months now, while Eurozone inflation has not captured its attention at all, as the European Central Bank has cut rates at every meeting in 2025. Maybe monetary policy matters? No, as we've already noted, even though the ECB keeps cutting rates, the euro continues to grow actively. Therefore, we don't believe the recent dollar strengthening has medium-term significance. We maintain that the upward trend on the hourly timeframe persists because Donald Trump's trade war continues.
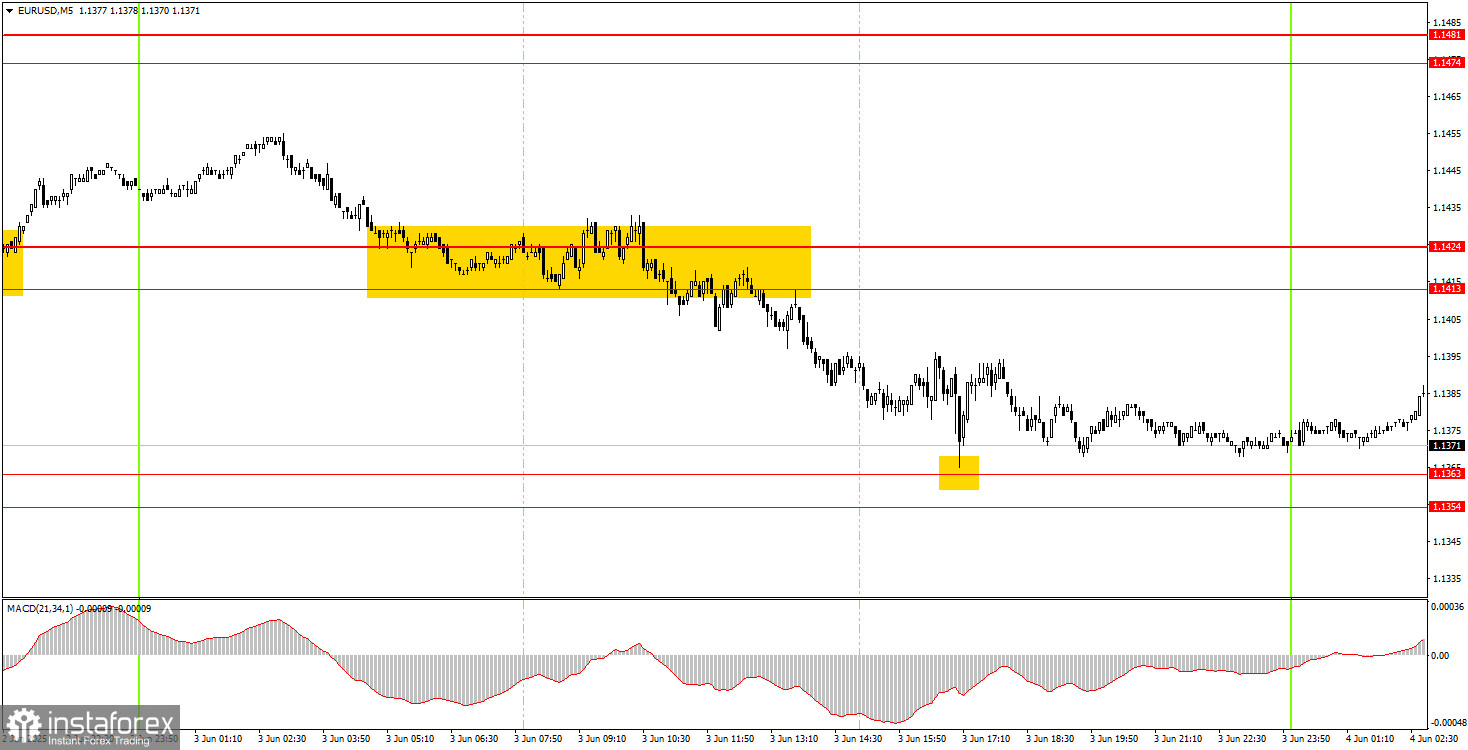
Two trading signals were formed in the 5-minute timeframe on Tuesday. First, for about 6-7 hours, the pair generated a sell signal near the 1.1413-1.1424 area. After this consolidation, a decline began, and the price, with minimal deviation, worked off the 1.1363 level and rebounded from it. Thus, novice traders could have opened short positions in the first half of the day and closed them in the second half. The profit was around 25 pips.
In the hourly timeframe, the EUR/USD pair broke the ascending trendline; however, the overall uptrend that began during Trump's presidency remains intact. Essentially, it only takes the fact that Trump is the U.S. president for the dollar to keep falling—this alone is enough for the market to flee from the dollar without hesitation. The trade war situation has not improved since Trump's tariffs couldn't be canceled.
On Wednesday, the EUR/USD pair can move in either direction because the impact of Trump's tariff hike has already been absorbed, and today's macroeconomic background will be relatively weak. Thus, it's better to trade based on technical factors unless Trump announces new tariffs.
On the 5-minute timeframe, consider the following levels: 1.0940-1.0952, 1.1011, 1.1088, 1.1132-1.1140, 1.1198-1.1218, 1.1267-1.1292, 1.1354-1.1363, 1.1413-1.1424, 1.1474-1.1481, 1.1513, 1.1548, 1.1571, 1.1607-1.1622. On Wednesday, business activity indices in the services sector are scheduled for release in Germany, the Eurozone, and the U.S., along with the ADP private sector employment report. We believe the ISM Services Index will have the most significant impact.
Support and Resistance Levels: These are target levels for opening or closing positions and can also serve as points for placing Take Profit orders.
Red Lines: Channels or trendlines indicating the current trend and the preferred direction for trading.
MACD Indicator (14,22,3): A histogram and signal line used as a supplementary source of trading signals.
Important Events and Reports: Found in the economic calendar, these can heavily influence price movements. Exercise caution or exit the market during their release to avoid sharp reversals.
Forex trading beginners should remember that not every trade will be profitable. Developing a clear strategy and practicing proper money management are essential for long-term trading success.


